
Figures & data
Figure 1. The clinicopathological and prognostic significances of KRT80 mRNA expression according to bioinformatics analysis. KRT80 mRNA expression was higher in esophageal cancer than normal tissue according to xiantao database (a), p < .05. It was compared with the histological subtypes of esophageal cancer by UALCAN (b) database. There was a negative relationship between KRT80 methylation and mRNA expression (c). KRT80 methylation level was lower in esophageal cancer than normal tissues by UALCAN (d), p < .05.
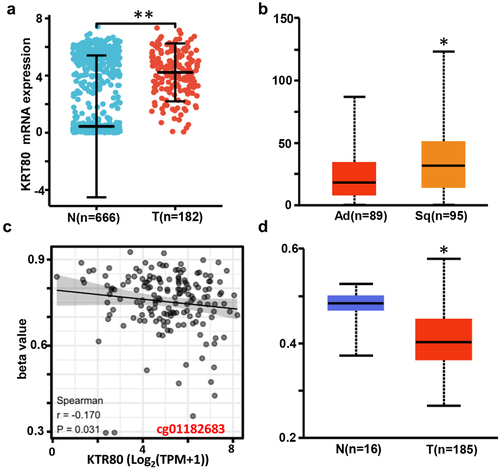
Figure 2. The differential genes and related signal pathways between low and high KRT80 expression in esophageal cancer. The volcano map of the differential genes was shown between low and high KRT80 expression in esophageal cancer (a). These genes were subjected to the signal pathway analysis using KEGG (b) and GSEA(c).
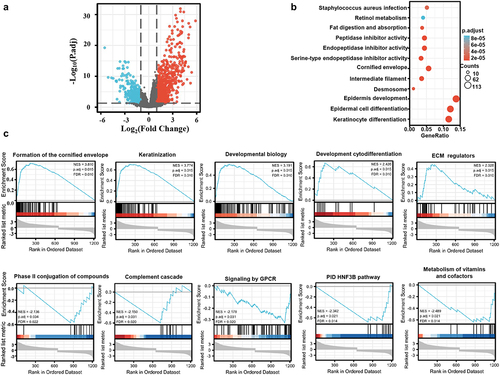
Figure 3. The KRT80-related genes and signal pathways in esophageal cancer. The positively related genes of KRT80 were screened (a), and were classified into the signal pathway using xiantao database (b). The negatively related genes of KRT80 were screened (c), and were classified into the signal pathway using xiantao database (d).
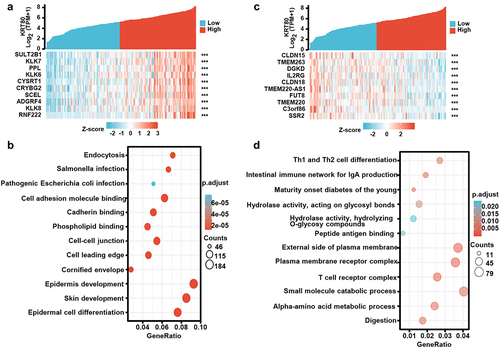
Figure 4. The clinicopathological significance of KRT80 protein expression in esophageal cancer. Western blot was used to detect KRT80 protein level in esophageal cancer (a). Densimetric analysis showed no difference in KRT80 expression between esophageal cancer and normal tissues (A, p > .05). Immunohistochemically, KRT80 protein was positively expressed in esophageal squamous epithelial and cancer cells (b). Kaplan–Meier curves and log-rank test were used to clarify the prognostic significance of KRT80 protein expression (c).
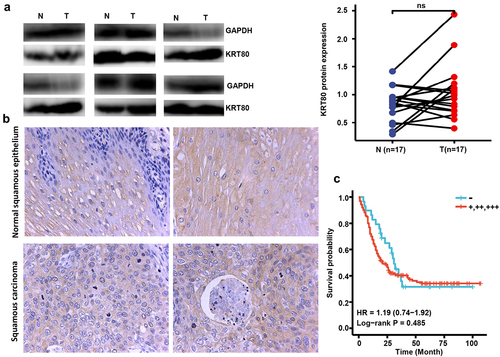
Table 1. KRT80 expression during esophageal carcinogenesis.
Table 2. The relationship between KRT80 protein expression and clinicopathological characteristics of esophageal cancer by immunohistochemistry.
Table 3. The survival analysis of the esophageal cancer patients by immunohistochemistry.
Figure 5. The effects of KRT80 knockdown on the aggressive phenotypes and phenotype-related protein of esophageal cancer cells. After transfection of siKRT80, KRT80 expression became weaker than the control in KYSE-150 cells by quantitative RT-PCR (a) and Western blot (b). The transfectants were subjected to the function assays of proliferation, chemosensitivity, migration and invasion, apoptosis by CCK-8 (c and d), wound healing (e) and transwell chamber (f), annexin V/7-AAD staining (g) respectively. The phenotype’s proteins were screened by Western blot (H).
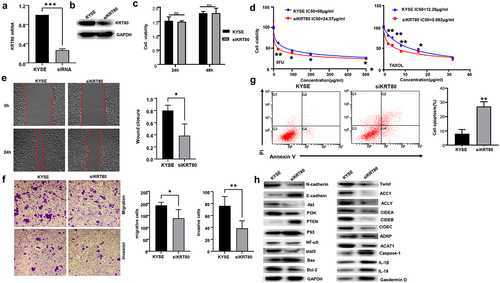
Figure 6. The effects of ACC1 and ACLY on the KRT80-mediated chemoresistance and lipogenesis. Either ACC1 and ACLY was overexpressed in siKRT80 transfectants of KYSE-150 cells, evidenced by Western blot (a). After the treatment of 5-FU and Taxol, KYSE-150 cells and transfectants were subjected to CCK-8 (b) and nile red staining (c) respectively.
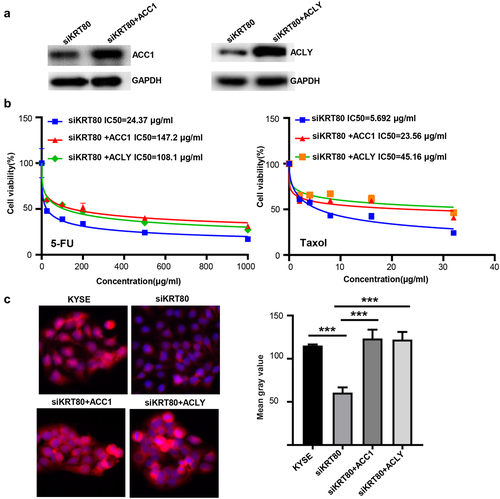
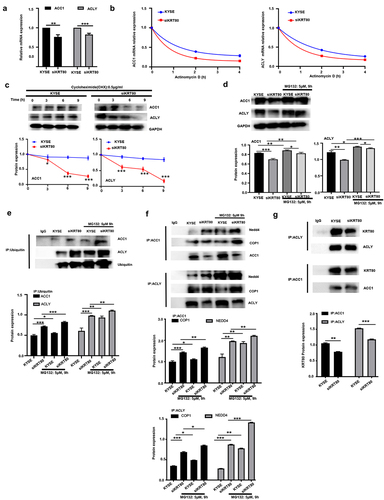
Figure 7. The effects of KRT80 on the stability of ACC1 and ACLY mRNA or protein. Either ACC1 or ACLY mRNA expression was hypoexpressed in siKRT80 transfectants of KYSE-150 cells, evidenced by real-time PCR (a). After the treatment of actinomycin D, we found that the stability of ACC1 and ACLY mRNA was reduced in siKRT80 transfectants (b). It was same for the stability of their encoding products, evidenced by Western bolt after the exposure to cycloheximide (CHX) (c). MG132 (a proteasomal inhibitor) treatment weakened the down-regulation of ACC1 and ACLY proteins in siKRT80 transfectants, compared with the control (d). Co-IP showed that KRT80 knockdown increased the ubiquitination of ACC1 and ACLY proteins (e), which might bind to ubiquitinases (COP1 and Nedd4, f and KRT80 protein (g).
Supplemental Material
Download Zip (1.2 MB)Data availability statement
The datasets used and/or analyzed are available from the corresponding author on reasonable request.