
Figures & data
Figure 1. RAF1 is expressed in a variety of breast cancer histological subtypes, and high expression of RAF1 is associated with the prognosis of HER-2 positive breast cancer. (a) the Kaplan-Meier database was used to analyze the relationship between the protein expression or mRNA level of RAF1 and overall survival and (b) distant metastasis-free survival in breast cancer patients with HER2 (±) or ER (+) breast cancer. (c) analysis of the expression of RAF1 in different histological subtypes of breast cancer based on the ualcan database (http://ualcan.Path.uab.edu/index.Html) (*, p < .05, ***, p < .001). (d) the expression of RAF1 in breast cancer (right) and adjacent tissues (left).
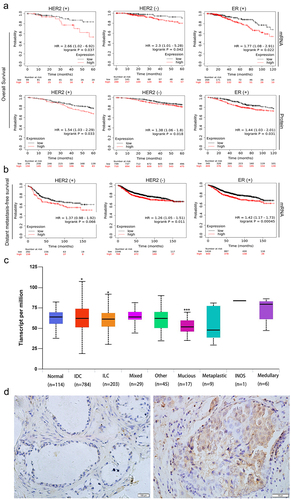
Table 1. RAF1 protein expression in breast cancer samples and adjacent tissue samples.
Table 2. Relationship between RAF1 overexpression and the clinicopathological features in breast cancer.
Figure 2. Pimozide inhibits breast cancer cell proliferation. (a) the pimozide structure was drawn using ChemDraw. (b) pimozide docked with RAF1 and found two binding sites by Schrodinger software, identified as site 1 and site 2. (c) MTT assay to assess the effects of different concentrations of pimozide on breast cancer cells (6 × 10Citation3 cells/well). (d) effect of 4 μM or 8 μM pimozide on the growth of breast cancer cells (5 × 10Citation4 cells) within 4 days. (e) after treatment with pimozide, the number of clones of breast cancer cells (1 × 10Citation3 cells) was reduced. Percent adhesion was normalized to DMSO control for 3 replicate experiments with 3 or more replicate wells (*, p < .05, ***, p < .001).
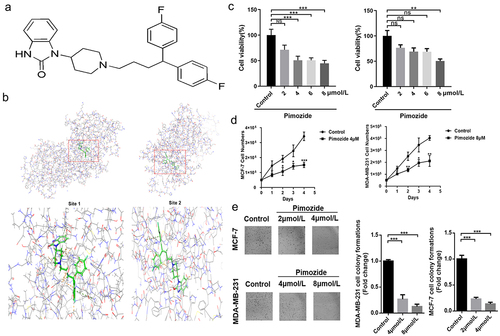
Figure 3. Pimozide inhibits breast cancer growth through the RAF/ERK signaling pathway. flow cytometry was used to detect apoptosis (a) and mitochondrial membrane potential (b) in breast cancer cells at different concentrations of pimozide. (c) AO-EB staining to identify normal cells (green), early apoptosis (yellow arrow), late apoptosis (red arrow), dead cells (blue arrow), MCF-7 (1 × 10Citation3 cells), and MDA-MB-231 cells (1 × 10Citation3 cells) were treated with 4 μM and 8 μM pimozide, respectively. (d) Western blot analysis of protein expression increased with the concentration of pimozide. (e) the effect of pimozide on the activities of caspase-6 after treating MCF-7 and MDA-MB-231 cells. Summary data from three replicate experiments with three replicate samples, ns means no statistical significance (*, p < .05, **, p < .01, ***, p < .001).
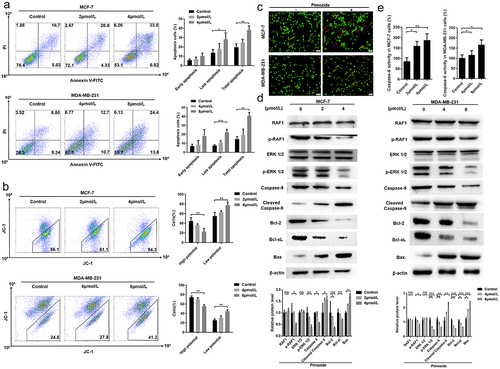
Figure 4. Pimozide might promote autophagy in breast cancer cells by up-regulating cAMP. TEM (a) and MDC staining (b) observed the number of autophagosomes in breast cancer cells after pimozide (4 μM or 8 μM) (red arrows indicate autophagosomes). (c) Western blot was used to detect autophagy-related proteins, and β-actin was used as an internal reference. (d) detection of changes in cAMP with increasing pimozide concentration based on the FRET system. The left image was the YFP fluorescence signal, the red circle represented the baseline, the other coils surrounded the cell, the right side was the CFP fluorescence signal, and ratio a meant the fluorescence intensity of the CFP was greater than the fluorescence intensity of the YFP. All experiments were performed three times in parallel, ns means no statistical significance (*, p < .05, ***, p < .001).
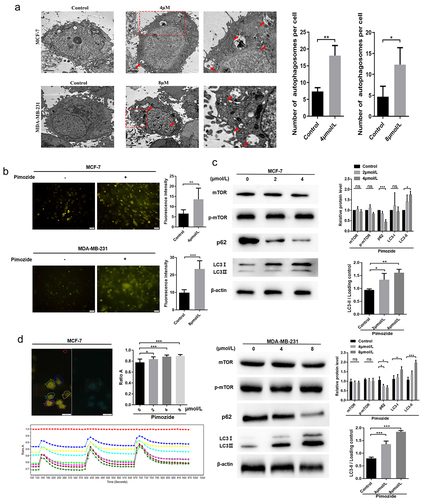
Figure 5. The effects of RAF1 interference and pimozide treatment on breast cancer cells. (a) the expression of RAF1 in MCF-7 cells was detected by Western blot after adding siRNA. (b) MTT assay was used to detect the effect of different concentrations of pimozide on the proliferation of breast cancer cells (6 × 10Citation3 cells/well) without pretreatment or knockdown of RAF1 expression. (c) cloning assay was performed to analyze the effects of pimozide (4 μM), siRNA, pimozide, and siRNA on the proliferation of MCF-7 cells (1 × 10Citation3 cells), respectively. (d) after adding pimozide (4 μM), siRNA, pimozide and siRNA, respectively, the expression of proteins was detected by western blot. (e) after adding pimozide (4 μM), Sorafenib (6 nM), pimozide and Sorafenib, respectively, the western blot was used to analyze the expression of proteins. All experiments were performed with DMSO as control and three times in parallel, ns means no statistical significance (*, p < .05, **, p < .01, ***, p < .001).
Figure 6. CQ blocks autophagy and repairs pimozide-induced apoptosis of breast cancer cells. (A) flow cytometry was used to examine the effect of pimozide (4 μM or 8 μM) or CQ (50 μM) alone and their combination on apoptosis of breast cancer cells, and cells supplemented with DMSO were used as controls. (B) cell proliferation and apoptosis marker protein expression were detected by immunofluorescence, and cells not treated with pimozide were used as controls. (C) TEM investigates the effects of pimozide (4 μM or 8 μM) or CQ (50 μM) alone and their combination on apoptosis of breast cancer cells, and the red arrow identifies autophagosomes. (D) after autophagy was blocked by CQ (50 μM), the expression of apoptosis and autophagy marker proteins were detected by western blot. All experiments were performed with DMSO as control and three times in parallel, ns means no statistical significance (*, p<0.05, **, p < .01, ***, p<0.001).
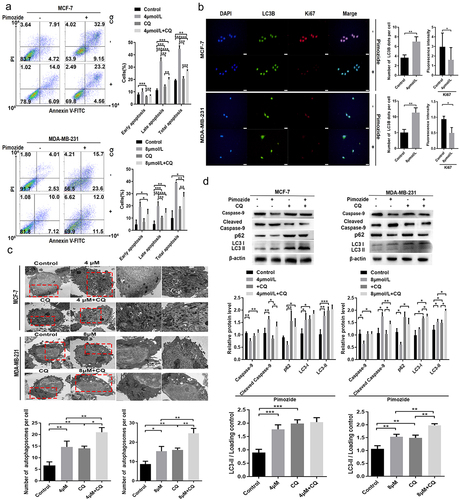
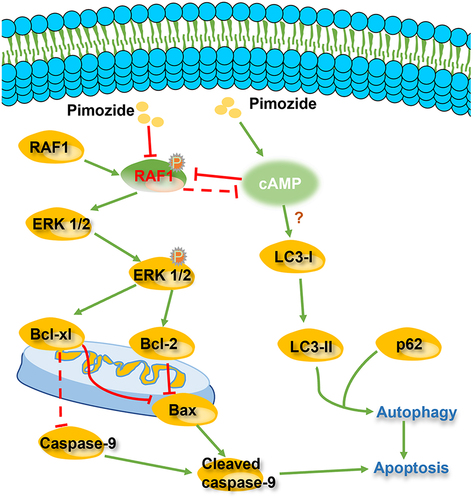
Figure 7. Pimozide exerts a possible mechanism of action to inhibit breast cancer activity..
Supplemental material.docx
Download MS Word (4.9 MB)Data availability statement
The data that support the findings of this study are available from the corresponding author, [S.L], upon reasonable request.