
Figures & data
Figure 1. Expression of SATB1 in the CRC tissues and its association with prognosis. (a) SATB1 staining in normal mucosal glandular epithelium and CRC tissues. In normal intestinal mucosa, SATB1 showed no staining in epithelial cells, whereas it showed strong positive staining in interstitial lymphocytes. In the tumor epithelial cells, SATB1 showed variable staining, including negative, moderate and strong staining. (b) The number of cases with different degree of SATB1 expression. (c) Kaplan-Meier survival curve of CRC patients with different degree of SATB1 expression. *p < .05 (log-rank test).
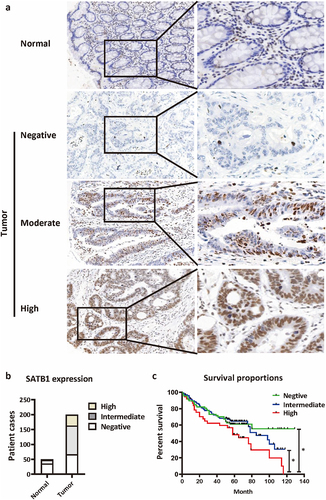
Table 1. SATB1 expression in primary CRC and lymph node metastasis.
Figure 2. SATB1 expression in the metastatic lesions is higher than that in primary lesions of CRC. (a) The percentage of negative, intermediate and high SATB1 expression in 200 primary cancer tissue and 80 lymph node metastases. (b) The expression of SATB1 in 80 paired primary cancer tissue and lymph node metastases. ***p < .001 (paired t-test). (c) SATB1 staining in primary cancer tissue, lymph node metastasis and distant organ metastasis from one patient. (d) Semi-quantitative analysis of SATB1 expression in five cases with paired primary tumors, lymph node metastases, and distant metastases.
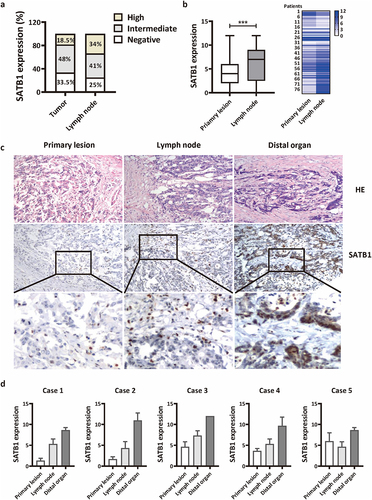
Figure 3. SATB1 promote CRC proliferation and colony formation. (a)The expression of SATB1 protein in SW480, HCT15, HCT116 and 293T cells was detected by western blot. (b), (c) RT-PCR and western blot were used to verify the interference results of SATB1 protein expression in SW480 cells. (d) CCK-8 assay showed that the proliferation ability of SATB1-knockdown cell line was decreased. (e) Clone formation experiment showed that SATB1-knockdown cell lines had reduced clone formation. The results represent at least three independent experiments. The data are represented as the mean ± SD ***p < .001 (two-tailed student’s t-test).
Figure 4. SATB1 inhibit CRC migration. (a) Schematic diagram illustrating transwell migration assay (created in BioRender.com). (b), (c) Western blot assay verified the SATB1-overexpression cell line, transwell assay showed that the migration ability of the overexpression cell line was weakened. (d), (e) the SATB1-knockdown cell line was verified by western blot, transwell assay showed that the migration ability of the knockout cell line was enhanced. (f) Transwell assay showed that rescuing SATB1 knockdown reduced cell migration ability. (g) Western blot verified SATB1 expression in each cell line. The results represent at least three independent experiments. The data are represented as the mean ± SD ***p < .001 (two-tailed Student’s t-test).
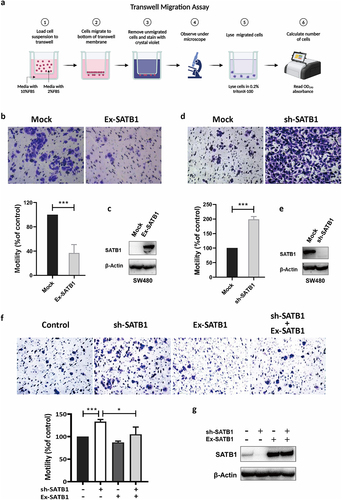
Figure 5. High expression of SATB1 co-localized with β-catenin in CRC tissues. (a) The expression of SATB1 was low and β-catenin was located in the cell membranes. (b) SATB1 and β-catenin were co-localized in the nucleus.
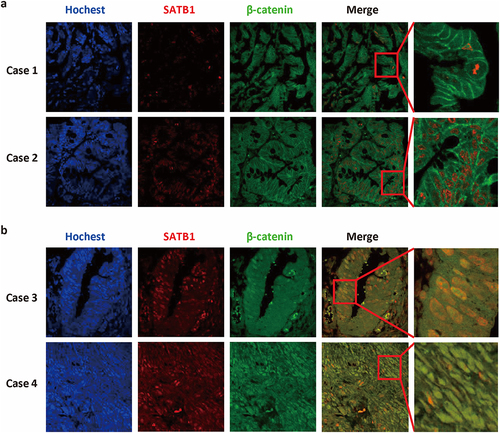
Figure 6. SATB1 regulated β-catenin at multiple levels. (a) Western blot detected the expression of SATB1 and β-catenin with the whole cell lysate, nuclear and cytoplasmic extract of SW480 cells. (b) Western blot detected the expression of SATB1 and β-catenin with the whole cell lysate and nuclear extract of SW620 cells. (c), (d) Co-immunoprecipitation detect SATB1/β-catenin protein interaction in SW480 and SW620 cells.
Supplementary Data_240131.docx
Download MS Word (283 KB)Data availability statement
The datasets used and analyzed in the present study are available from the corresponding author upon reasonable request.