
Figures & data
Figure 1. Overexpression of RND1 suppressed the progression and migration of GBM cells. (a) The colony formation assay was performed when RND1 was overexpressed in U87 and U251 cells. (b-c) the cell viability of U87 and U251 was detected when RND1 was upregulated. (d-e) wound-healing assay was performed in U87 and U251 cells transfected with flag-RND1. (f-g) Transwell assay was performed to assess the migration ability of U87 and U251 cells. (H) RND1 overexpression was confirmed by western blot analysis. Results were obtained in three independent experiments and quantified. *, p < .05; **, p < .01; ***, p < .001.
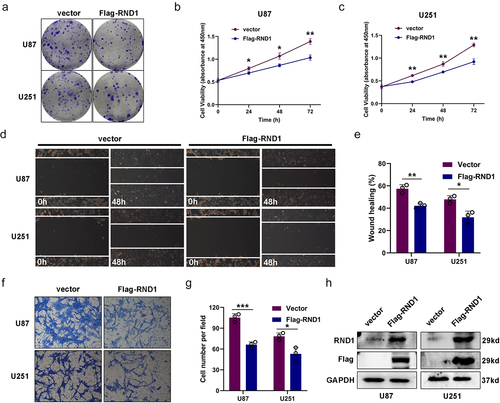
Figure 2. RND1 knockdown facilitated the growth and invasion of GBM cells. (a) The colony formation assay was performed when RND1 was knocked down in U87 and U251 cells. (b-c) the cell viability of U87 and U251 was detected when RND1 was downregulated. (d-e) wound-healing assay was performed in U87 and U251 cells transfected with shRND1. (f-g) Transwell assay was performed to assess the migration ability of U87 and U251 cells. (h) RND1 knockdown efficiency was confirmed by western blot analysis. Results were obtained in three independent experiments and quantified. *, p < .05; **, p < .01; ***, p < .001.
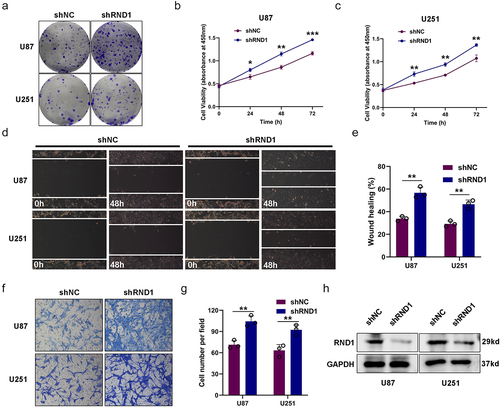
Figure 3. RND1 inhibited the EMT in GBM. (a-i) the correlation between RND1 and a series of EMT-related genes was analyzed based on RNAseq data of 703 glioma tissues from TCGA database. P-values were obtained from Pearson correlation. RND1 was positively correlated with anti-EMT genes (TJP1 and CDH1) and negatively correlated with pro-EMT genes (MMP2, MMP3, MMP9, SNAI1, SNAI2, CDH2 and VIM). SNAI1, also known as Snail1; SNAI2, also known as Slug; TJP1, also known as ZO-1; CDH1, also known as E-Cadherin; CDH-2, also known as N-cadherin; VIM, also known as Vimentin. (j-l) the protein (E-cadherin, N-cadherin, Vimentin, Snail1 and mmp2) expression was detected via western blot assay when RND1 was overexpressed or knocked down in U87.
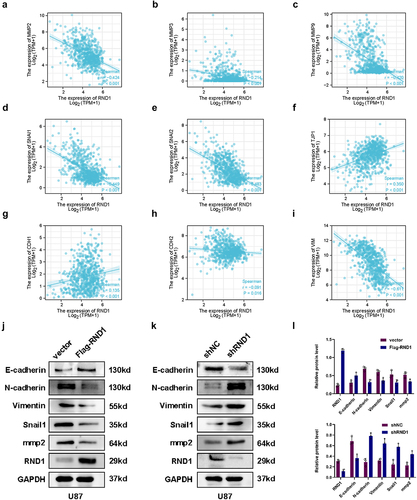
Figure 4. RND1 regulated the EMT of GBM cells via AKT signal. (a) Protein (AKT, p-AKT, GSK3-β, p-GSK3-β, MAPK, p-MAPK, Smad3, and β-catenin) levels were detected via western blot assay when RND1 was upregulated in U87 cells. Protein levels of western blots were quantified (d). (b) Protein (AKT, p-AKT, GSK3-β, p-GSK3-β, E-cadherin, Vimentin, mmp2, and Snail1) levels were detected via western blot assay when RND1 was knocked down in U87 cells with the treatment of SC66 (an inhibitor of AKT phosphorylation). (c) Transwell assay was performed to assess the migration ability of U87 and representative images were shown. Knockdown of RND1 facilitated the invasion of U87 cells, which could be reversed by SC66. (e) Invasive cells in transwell assay were quantified. *, p < .05; **, p < .01; ***, p < .001; ns, no significance.
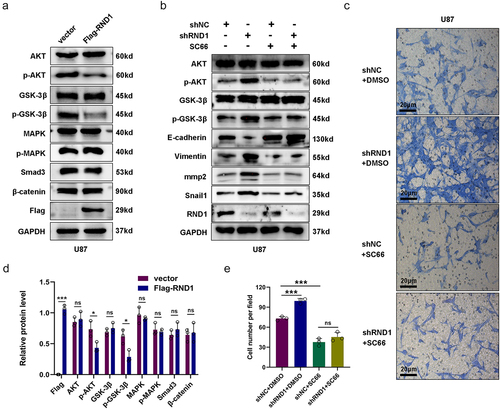
Figure 5. RND1 enhanced the TMZ sensitivity of normal and TMZ-resistant GBM cells. (a) The cell viability assay was performed in normal U87 cells (U87-WT) treated with TMZ when RND1 was overexpressed or knocked down. Results indicated that RND1 enhanced the TMZ sensitivity in U87-WT. (b) The cell viability assay was performed in TMZ-resistant U87 cells (U87-TR) treated with TMZ when RND1 was overexpressed. Results indicated that RND1 enhanced the TMZ sensitivity in U87-TR. (c) Wound-healing assay was conducted in U87-TR treated with TMZ when RND1 was overexpressed. The percentage of wound-healing was quantified (d). (e) Transwell assay was performed to assess the migration ability of U87-TR cells treated with TMZ and flag-RND1. (f) Invasive cells in transwell assay were quantified. *, p < .05; **, p < .01; ***, p < .001.
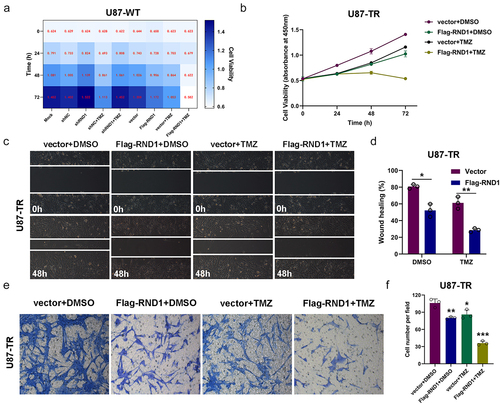
Figure 6. RND1 enhanced the TMZ sensitivity of GBM cells via inhibiting AKT signal. (a) Protein (AKT, p-AKT, GSK3-β, p-GSK3-β, E-cadherin, Vimentin, mmp2 and Snail1) levels were detected via western blot assay in U87-WT and U87-TR cells. Protein levels of western blots were quantified (c). (b) Protein (AKT, p-AKT, GSK3-β, p-GSK3-β, N-cadherin, Vimentin and Snail1) levels were detected via western blot assay in U87-TR cells transfected with flag-RND1. Protein levels of western blots were quantified (d). (e) The cell viability assay was performed when RND1 was overexpressed in U87-TR cells with the treatment of SC79 (an activator of AKT phosphorylation). Overexpression of RND1 enhanced the TMZ sensitivity of U87-TR cells, which could be reversed by SC79. (f) Protein (AKT and p-AKT) levels were detected via western blot assay in U87-TR cells transfected with flag-RND1 when SC79 was used. *, p < .05; **, p < .01; ***, p < .001; ns, no significance.
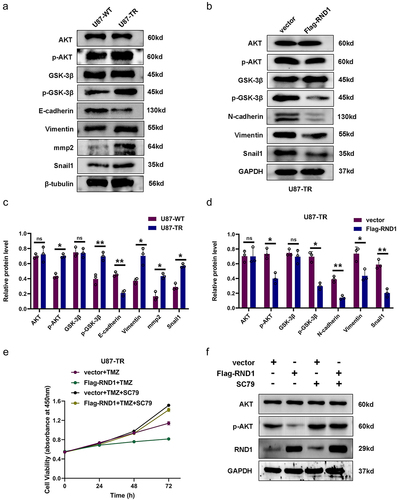
Figure 7. RND1 enhanced the TMZ sensitivity of GBM in xenograft mouse model. (a-b) RND1 suppressed the growth and enhanced the TMZ sensitivity of GBM in xenograft mouse model. Luciferase fluorescence of mouse xenografts was detected and quantified using IVIS at the 21st day. Luc groups, n = 5; Luc-RND1 groups, n = 5; Luc+TMZ groups, n = 5; Luc-RND1+TMZ groups, n = 5. (c-d) subcutaneous tumors were excised and weighed after mice sacrifice. The weight of tumors was analyzed. *, p < .05; **, p < .01; ***, p < .001.

Supplemental Material
Download Zip (355.3 KB)Data availability statement
The data used to support the findings of this study are available from the corresponding author upon request.