
Figures & data
Table 1. The parameters of miranda software.
Table 2. The PCR primers of miR-1343-3p, MAP3K6, and MMP24 genes.
Figure 1. Salidroside induced cell cycle arrest and apoptosis in gastric cancer cells. The S-phase cell cycle was arrested in gastric cancer cells after salidroside treatment for 48 h (A). Gastric cancer cell apoptosis was detected by flow cytometry analysis (B). Compared with the NS control group, cancer cell apoptotic index was significantly higher in the 8 mg/ml salidroside treatment group. Chi-square test for comparison between different groups, data is presented as mean ± SD, n = 3, *p <.05 (C).

Figure 2. Salidroside inhibited the invasion of gastric cancer cells. Salidroside inhibited gastric cancer cells motility in a dose-dependent manner (A), and resulted in the decreased migration rates of gastric cancer cells (B). Salidroside treatment groups vs NS control group, data is presented as mean ± SD, n = 3, *p <.05. Scale bar: 50 μm.
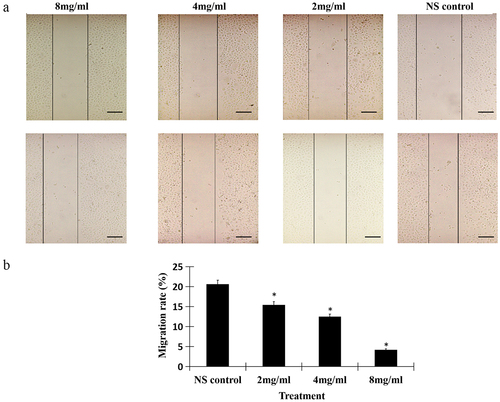
Figure 3. Target genes and heat map of differentially expressed miRnas. Bioinformatics analysis showed that 44 miRnas and 1384 corresponding target mRnas were expressed differentially in gastric cancer cells under the treatment of salidroside.
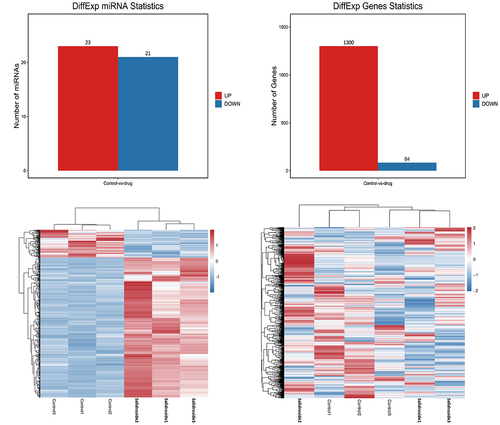
Figure 4. GO function and KEGG pathway analysis of miRNA target genes. GO functional enrichment (A) and KEGG pathway enrichment (B) analysis showed that the interaction between differentially expressed miRnas and their target genes was involved in most biological processes and signal pathways during the progression of gastric cancer cells, including cell proliferation, differentiation, apoptosis, metabolism, autophagy and migration. It showed that differentially expressed miRnas played important roles in regulating the proliferation of gastric cancer cells under the treatment of salidroside.
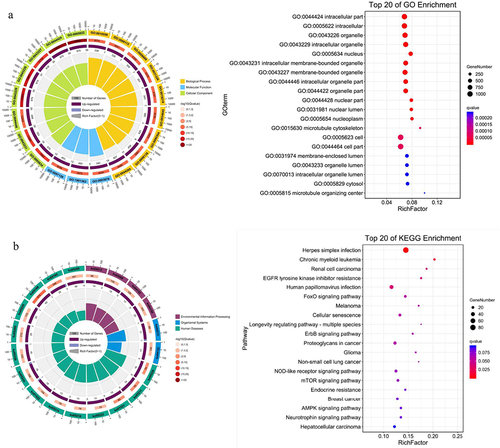
Figure 5. Network of miRnas and their target genes. miRNA-mRNA targeting analysis predicted that 29 mRnas were negatively regulated by miR-1343-3p, in which the mRNA genes of mitogen activated protein kinase kinase kinase 6 (MAP3K6) and membrane matrix metalloproteinase 24 (MMP24) signal pathway closely related to tumor proliferation and migration were significantly down-regulated.
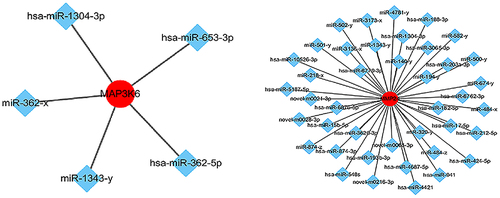
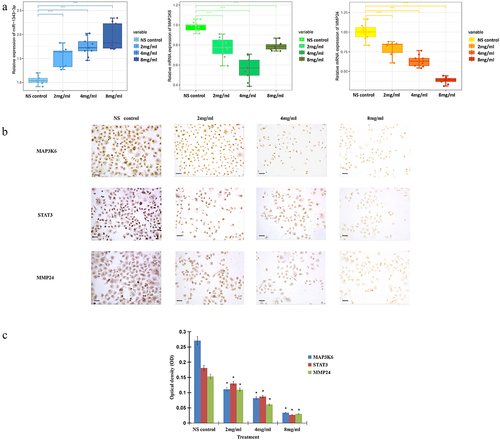
Figure 6. Salidroside inhibited the expression of miR-1343-3p, MAP3K6, MMP24 and STAT3 in gastric cancer cells. q-PCR results showed that compared with the NS control, the expression of MAP3K6 and MMP24 genes in gastric cancer cells were significantly down-regulated after different concentrations of salidroside treatment, whereas miR-1343-3p was significantly up-regulated. The higher the concentration of salidroside, the higher the expression level of miR-1343-3p (A). Variance analysis for comparison between different groups, data is presented as mean ± SD, n = 3, *p <.05. Immunohistochemistry showed that the expression of MAP3K6, STAT3 and MMP24 signal proteins in gastric cancer cells decreased after different concentrations of salidroside treatment. The higher the concentration of salidroside treatment, the weaker the staining of signaling molecules in the cancer cells (B) and the lower the relative ration of OD values (C). Chi-square test for comparison between different groups, data is presented as mean ± SD, n = 3, *p <.05. Scale bar: 20 μm.
Data availability statement
The datasets analyzed in the present study are available from the corresponding author on reasonable request.