
Figures & data
Figure 1. (a) Effects of increasing concentrations (0.5, 1, 5, and 10 nM) of Cab on the cell viability of Cab-treated cell lines for 24, 48, and 72 h (n = 6, **p < .01) (b) Annexin V assay reveals the apoptotic effect of Cab at the increasing concentrations as 1, 5 and 10 nM in Cab-treated cell lines for 48 h (n = 3, **p < .01) (c) The PI-based cell cycle assay indicates the effect of different Cab concentrations on the G2/M cycle arrest of Cab-treated cells for 48 h (n = 3, **p < .01). Effects of increasing Cab concentrations are plotted on the horizontal axis for the annexin V and cell cycle assays. At the same time, analysis results for different cell lines (the names of the cells are highlighted in red) are arranged vertically; p-values were calculated by one-way ANOVA and Tukey’s multiple comparisons tests in GraphPad Prism 9.0 (La Jolla, CA, USA). In the graphs, **p < .01 indicates significant differences compared to the control group of each cell line. Cab, Cabazitaxel; control, non-Cab-treated group.
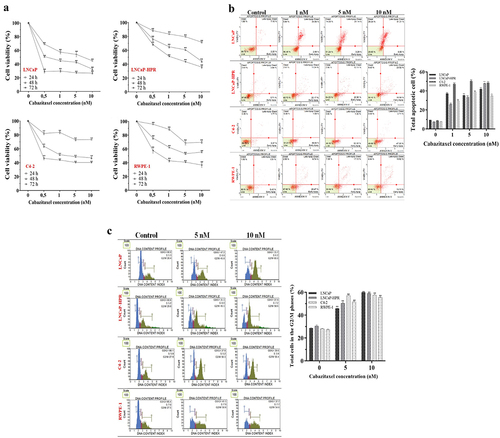
Figure 2. (a) Effects of 5 and 10 nM Cab on the ROS profile of 24 h-Cab treated cell lines (n = 3, **p < .01) (b) Morphological ROS analysis of 10 nM Cab indicates that the accumulation of H2O2 in the subcellular localization visualized by green fluorescence increase after Cab treatments in different cells. The merge images show the H2O2-positive cells with Hoechst dye for nuclear staining in the total cell population for each cell line (c) Effect of different Cab concentrations on the total GSH (ng) levels of each cell line (n = 3, *p < .05, **p < .01). The levels of total GSH as ng are calculated using the standard calibration curve with seven different standard concentrations: 0, 20, 40, 60, 80, 100, and 120 ng. Based on the OD values of these standards at 415 nm, the standard curve graph equation used to calculate the changes in the total GSH levels of the cells is y = 0.0231× + 0.8426 (d) Effects of 5 and 10 nM Cab on the mitochondrial membrane potential of Cab-treated cell lines for 24 h (n = 3, **p < .01). Effects of increasing Cab concentrations are plotted on the horizontal axis for the ROS and MitoPotential assays. At the same time, analysis results for different cell lines (the names of the cells are highlighted in red) are arranged vertically; p-values were calculated by one-way ANOVA and Tukey’s multiple comparisons tests in GraphPad Prism 9.0 (La Jolla, CA, USA). In the graphs, *p < .05, **p < .01 indicates significant differences compared to the control group of each cell line. Cab, Cabazitaxel; control, non-Cab-treated group; ROS, reactive oxygen species; GSH, glutathione; H2O2, hydrogen peroxide.
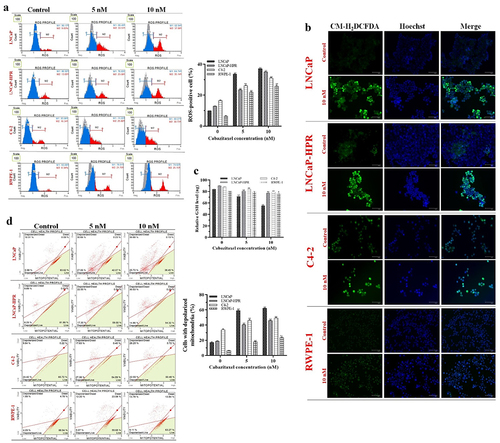
Figure 3. Effect of 5 and 10 nM Cab on the mRNA levels of the redox-sensitive transcription factors and antioxidant enzymes in (a) LNCaP (b) LNCaP-HPR (c) C4–2 (d) RWPE-1 cells (n = 3, *p < .05, **p < .01). GAPDH was used as a housekeeping gene to normalize mRNA expression levels of the indicated genes. The fold changes of mRNAs and p-values were calculated using the 2–ΔΔCt method in a web‑based tool at https://dataanalysis2.qiagen.com/pcr to analyze gene expression differences between the control and Cab-treated groups. Effect of increasing Cab concentrations on the active protein levels of the redox-sensitive transcription factors at cytoplasmic and nuclear compartments of Cab-treated (e) LNCaP (f) LNCaP-HPR (g) C4–2 (h) RWPE-1 cell lines (n = 3, *p < .05, **p < .01). Relative protein expression at cytoplasmic fractions was determined using β-actin as an internal control. Moreover, histone H3 was used as a housekeeping protein to calculate the relative expression levels of the nuclear active forms of the indicated proteins. P-values were calculated by one-way ANOVA and Tukey’s multiple comparisons tests in GraphPad Prism 9.0 (La Jolla, CA, USA). In the relative protein expression graphs, *p < .05, **p < .01 indicates significant differences compared to the control group of each cell line for cytoplasmic and nuclear fractions.
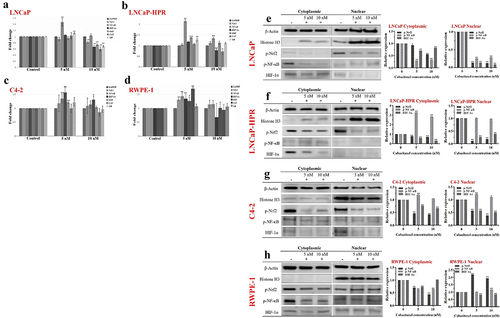
Figure 4. Immunofluorescence analysis shows the effect of the increasing Cab concentrations on the p-Nrf2 expression and subcellular localization in the Cab-treated cell lines. On the horizontal axis of the microphotograph group for each cell line, (a) control, (b) 5 nM, and (c) 10 nM Cab. For each group, six independent images were obtained. In the groups for each cell line, the last two columns are the merged images for the indicated protein and nuclear staining with Hoechst dye. The scale bar represents 100 µm at 20X magnification. However, the microphotographs in the last column were obtained as larger images using a 50 µm scale bar at 20X magnification.
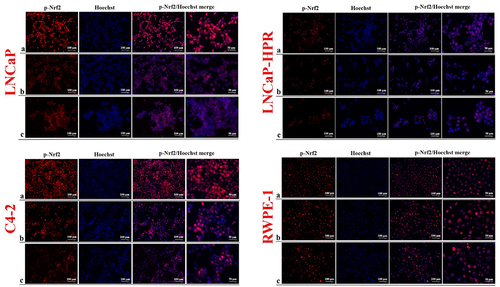
Figure 5. Immunofluorescence analysis shows the effect of the increasing Cab concentrations on the p-NF-κB expression and subcellular localization in the Cab-treated cell lines. On the horizontal axis of the microphotograph group for each cell line, (a) control, (b) 5 nM, and (c) 10 nM cab. For each group, six independent images were obtained. In the groups for each cell line, the last two columns are the merged images for the indicated protein and nuclear staining with Hoechst dye. The scale bar represents 100 µm at 20X magnification. However, the microphotographs in the last column were obtained as larger images using a 50 µm scale bar at 20X magnification.
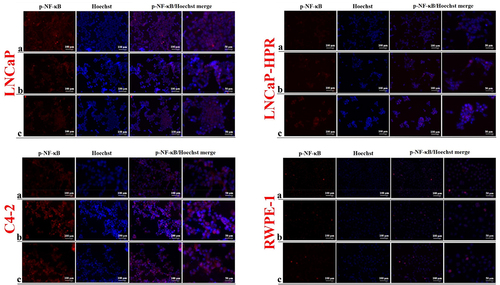
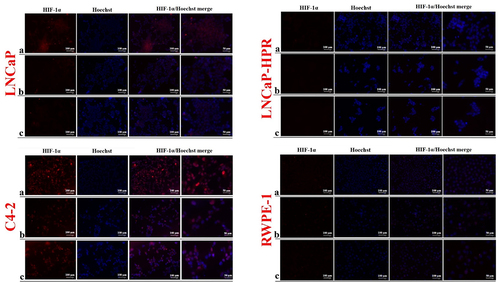
Figure 6. Immunofluorescence analysis shows the effect of the increasing Cab concentrations on the HIF-1α expression and subcellular localization in the Cab-treated cell lines. On the horizontal axis of the microphotograph group for each cell line, (a) control, (b) 5 nM, and (c) 10 nM cab. For each group, six independent images were obtained. In the groups for each cell line, the last two columns are the merged images for the indicated protein and nuclear staining with Hoechst dye. The scale bar represents 100 µm at 20X magnification. However, the microphotographs in the last column were obtained as larger images using a 50 µm scale bar at 20X magnification.
Data availability statement
The data that support the findings of this study are available from the corresponding author, [author initials], upon reasonable request.