
Figures & data
Figure 1. CPT1A is highly expressed in PCa tissues and cell lines. (a) GEPIA was used to analyze the dysregulated expression of CPT1A in PCa. PRAD: prostate adenocarcinoma. T: tumor and N: normal. (b) The expression of CPT1A in PCa tissues and the normal tissues was detected by qPCR. (c) The expression of CPT1A in PCa cell lines and the prostate epithelial cell line (PNT2) was detected by qPCR. *p<.05 in (A). **p < .01, ***p < .001 vs PNT2 group.
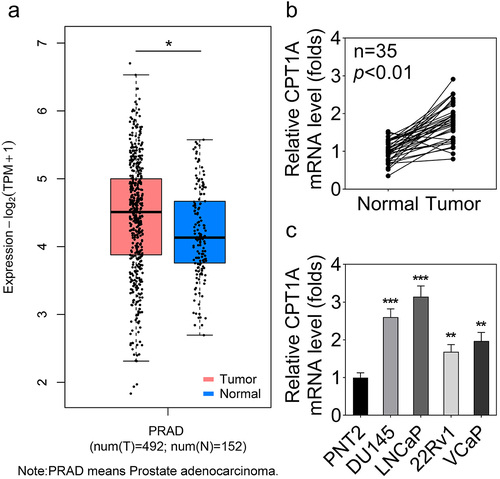
Figure 2. Silencing of CPT1A inhibits the viability and glycolysis of PCa cells. (a) mRNA expression of CPT1A after transfection. (b) Protein levels of CPT1A after transfection. (c) Cell viability was evaluated by CCK-8 assay. (d,e) glucose consumption and lactate production were measured using commercial kits. (f,g) Seahorse was used to detect the glycolysis of PCa cells after transfection. *p < .001 vs si-nc group.
Figure 3. CPT1A promotes the expression of PDPK1 without succinylation modulation. (a,b) the LinkedOmics database was used to screen the positively correlated genes of CPT1A. (c) Enrichment analysis was performed. (d,e) the LinkedOmics and GEPIA databases were used to further confirm the relation between CPT1A and PDPK1. (f) qPCR was performed to detect CPT1A RNA expressions after transfection. (g) Western blot was conducted to measure CPT1A protein levels after transfection. (h) qPCR was used to measure the expression of PDPK1 mediated by CPT1A. (I) Western blot was used to detect the succinylation and expression of PDPX1. *p < .01, **p < .001.
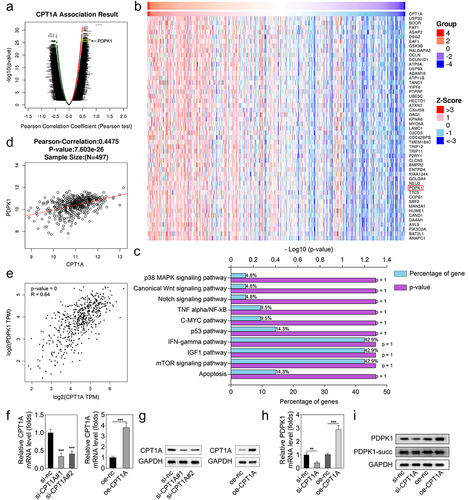
Figure 4. CPT1A binds with SP5 to modulate the transcription of PDPK1. (a) Genecards, GEPIA and JASPAR were used to screen the transcriptional factors that regulated the transcription of PDPK1. (b,c) the sites in the promoter of PDPK1 potentially bind with SP5 or HOXA3 was shown. (d) Luciferase assay was carried out to check whether SP5 or HOXA3 could regulate the transcription of PDPK1. (e) CO-IP was performed to detect the binding between CPT1A with SP5 or HOXA3. (f) ChIP assay was used to investigate the binding between SP5 or HOXA3 with the promoter of PDPK1 after CPT1A overexpression. (g) Luciferase assay was performed to assess the luciferase activity of PDPK1 in each group. (H) qPCR was used to detect the RNA expression. *p < .001 vs oe-nc, ## p < .01, ### p < .001 vs oe-CPT1A+si-nc.
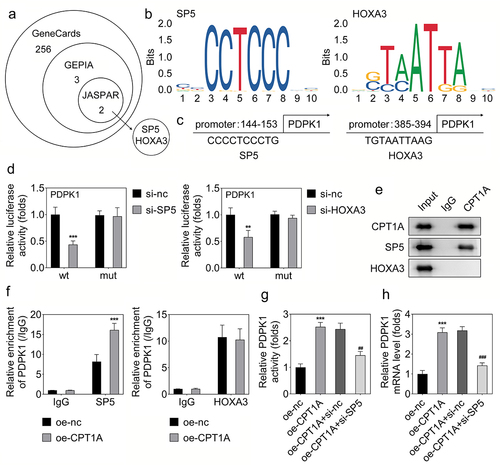
Figure 5. CPT1A mediates the succinylation of SP5. (a) The succinylation level of SP5 after CPT1A overexpression was detected by western blot. (b) The potential succinylation sites in SP5 were predicted using the SuccinSite database. (c) Western blot analysis was used to evaluate the succinylation level of SP5 after transfection of WT, K391R or K354R expressing vectors. (d) The activity of PDPK1 was evaluated in each group. *p < .001 vs oe-nc, ## p < .01 vs oe-CPT1A.
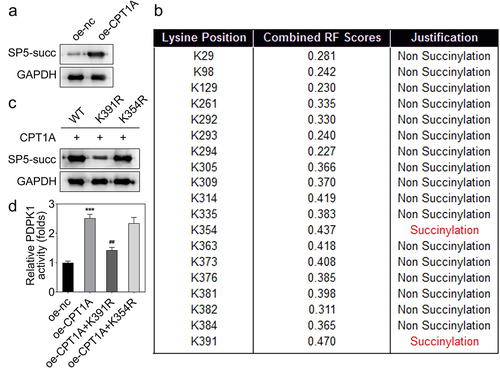
Figure 6. PDPK1 regulates the AKT/mTOR signal pathway. (a) Western blot was used to detect the expression and phosphorylation of AKT and mTOR.
Figure 7. PDPK1 overexpression reversed the effects of CPT1A silencing on the viability and glycolysis of PCa cells. (a) qPCR and (b) western blot were used to detect the expression of PDPK1 after transfection. (c) Cell viability was evaluated by CCK-8 assay. (d,e) glucose consumption and lactate production were measured using commercial kits. (f,g) Seahorse was used to detect the glycolysis of PCa cells after transfection. *p <.001 vs si-nc+oe-nc group, ## p < .01, ### p < .001 vs oe-CPT1A group.
Data availability statement
The datasets used and/or analyzed during the current study are available from the corresponding author on reasonable request.