
Figures & data
Table 1. Primer sequences for qRT-PCR.
Figure 1. METTL14 is downregulated in CC tissues and correlates with poor prognosis of CC patients. (a,b) determination of the m6A content in CC tissue (A) and cell lines (B). (c,d) METTL14 expression in CC tissues was determined by qRT-PCR (C) and western blotting (D). (e,f) expression of METTL14 in CC cell lines determined by qRT-PCR (E) and western blotting (F). (g) The survival outcome of CC patients with low and high expression of METTL14. *, p < .05; **, p < .01; and ***, p < .001.
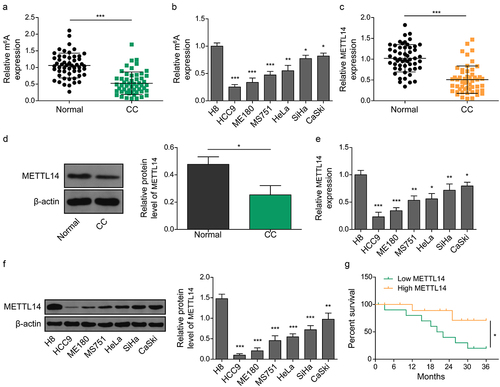
Table 2. Correlation between METTL14 expression and clinical pathological characteristics in cervical cancer patients (n = 53).
Figure 2. METTL14 is upregulated during sorafenib-induced ferroptosis. (a) Cell survival ability of CC cells after pre-treatment with different concentrations (0, 1, 2.5, 5, 10, 20 μM) of sorafenib for 48 h, measured at the indicated time and the results were compared with the control group. (B-L) CC cells were pre-treated with sorafenib (10 μM, 48 h) and/or administration of ferroptosis inhibitor fer-1. (b) Cell survival ability of CC cells was measured using CCK-8. (c) Mitochondrial morphology alterations in cells were determined using TEM. Red arrows: typical mitochondria morphology. Blue arrows: shrunken mitochondria morphology. (scale bar = 1 μm). (d–h) MDA (D), ROS (E), lipid peroxidation (F), GSH (G) and Fe2+ (H) levels in cells were evaluated using commercial kits. (i) Protein levels of GPX4 and SLC7A11 were verified by western blotting. (j) m6A levels were determined using RIP-qPCR. (k,l) expression of METTL14 in cells was determined by qRT-PCR (J) and western blotting (K). *, p < .05; **, p < .01; and ***, p < .001.
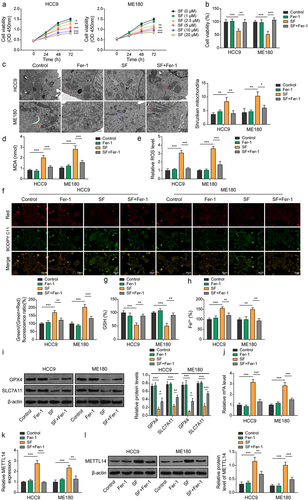
Figure 3. Silencing of METTL14 inhibits sorafenib-induced ferroptosis in CC cells. (a–i) CC cell lines were transfected with sh-NC or sh-METTL14 and treated with sorafenib. (A-B) expression of METTL14 in cells was determined by qRT-PCR (A) and western blotting (B). (C) Cell viability was verified using CCk-8 assays. (D) Mitochondrial morphology alterations in cells were evaluated by TEM. Red arrows: typical mitochondria morphology. Blue arrows: shrunken mitochondria morphology. (scale bar = 1 μm). (E-H) MDA (D), ROS (E), GSH (F) and Fe2+ (G) levels in cells were determined using commercial kits. (I) Protein levels of GPX4 and SLC7A11 were confirmed by western blotting. *, p < .05; **, p < .01; and ***, p < .001.
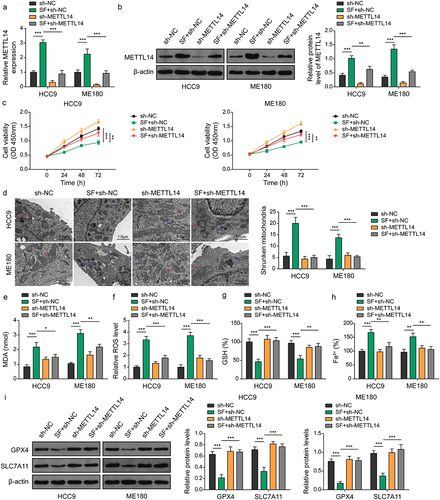
Figure 4. METTL14 decreases the stability of FTH1 in an m6A-dependent manner. (a,b) the mRNA expression of FTH1 in CC was determined using qRT-PCR (A) and western blotting (B). (C) Correlation between FTH1 and METTL14 was assessed using Pearson analysis. (d,e) the mRNA expression of FTH1 in different CC cell lines was detected using qRT-PCR (D) and western blotting (E). Of note, *, ** or *** indicates results compared to the H8 cell, while ### indicates results compared to HCC9 or ME180. (f,g) expression of FTH1 in CC cell lines after transfecting with pcDNA-METTL14 or sh-METTL14 were confirmed by qRT-PCR (F) and western blotting (G). (h,i) the m6A methylation level of FTH1 mRNA in CC cell lines after treating with sorafenib (H) or transfecting with pcDNA-METTL14 or sh-METTL14 (I) determined using RIP-qPCR. (J) Detection of FTH1 mRNA stability by qRT-PCR in CC cell lines after transfecting with pcDNA-METTL14 or sh-METTL14. (K) Regulation between METTL14 and FTH1 was verified by luciferase activity reporter assay. Of note, no significant differences were observed among the groups with MUT 3’UTR. *, p < .05; p < .01; ***, p < .001; and ###, p < .001.
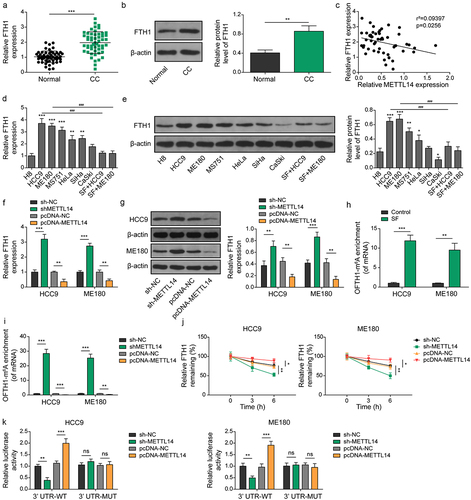
Figure 5. METTL14 promotes sorafenib-induced ferroptosis via FTH1 mediated PI3K/Akt pathway. CC cell lines were transfected with pcDNA-METTL14 and/or pcDNA-FTH1 and treated by sorafenib treatment. (a) Western blotting was conducted to detect protein levels of METTL14, FTH1, PI3K, AKT, and phosphorylation of PI3K and akt. (b) Cell viability was confirmed by CCK-8 following treatment with 10 μM sorafenib for 48 h. (c–f) levels of MDA (C), ROS (D), GSH (E) and Fe2+ (F) levels in cells were assessed by commercial kits. (G) Expression of GPX4 and SLC7A11 was determined using western blotting. *, p < .05; **, p < .01; and ***, p < .001.
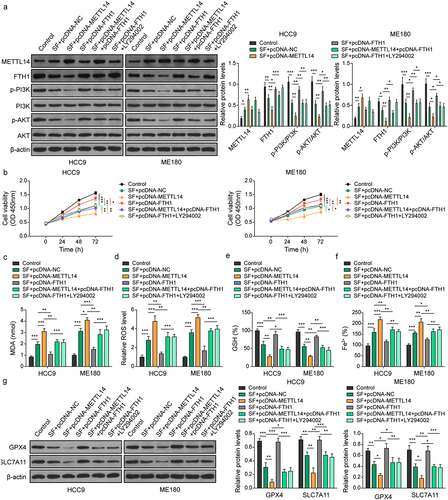
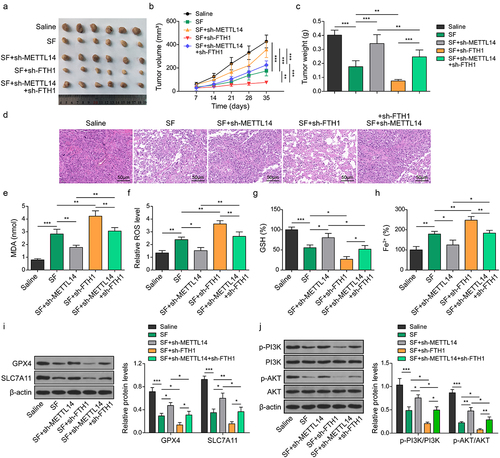
Figure 6. METTL14 enhances the sorafenib sensitivity of CC cells via inhibiting FTH1.
Data availability statement
All data generated or analyzed during this study are included in this published article.