
Figures & data
Table 1. The demographic profile of the RNAseq samples from the Cancer Genome Atlas.
Figure 1. Kaplan-Meier curve showing the difference in survival between the HPV-positive and HPV-negative tumors. HPV-positive tumors aggregate several papilloma virus strains. Patients with HPV-positive HNSCC have better overall survival. This curve does not control for covariates.
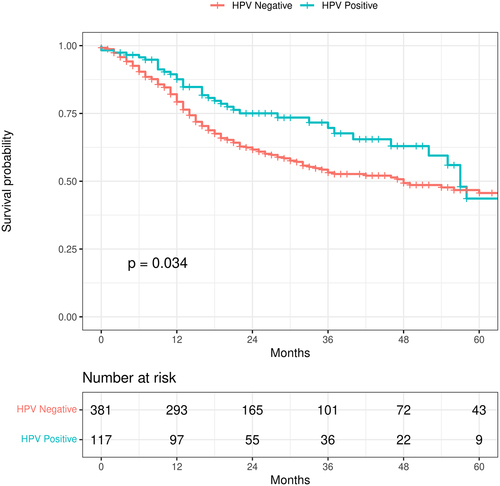
Figure 2. Hazard ratio (x-axis) and p-values (y-axis) generated from the cox-hazard proportional model that analyzed the overall survival with the presence of each microbe, controlling for stage, smoking status, and age. The diamond represents the alphapapillomavirus 9, a strain of HPV.
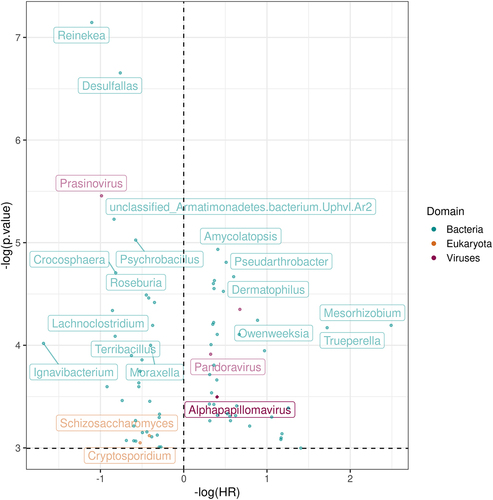
Figure 3. Hazard ratio (x-axis) and p-values (y-axis) from the cox-hazard proportional model analyzing the overall survival with the presence of each microbe, after excluding microbes present in less than 10 samples.
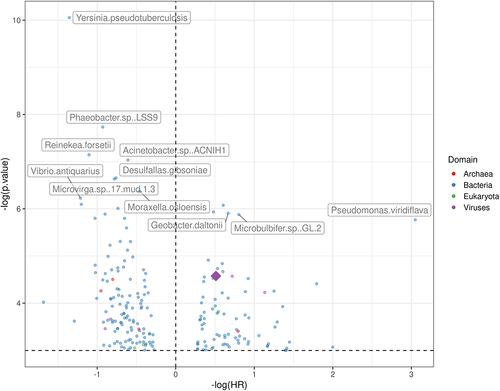
Figure 4. Differentially expressed microbes by HPV-status. The x-axis shows HPV-negative (left, negative -log2 fold change) and HPV-positive (right, positive -log2fold change), and the y-axis is the negative log of p-value for the microbes associated with each type of tumor.
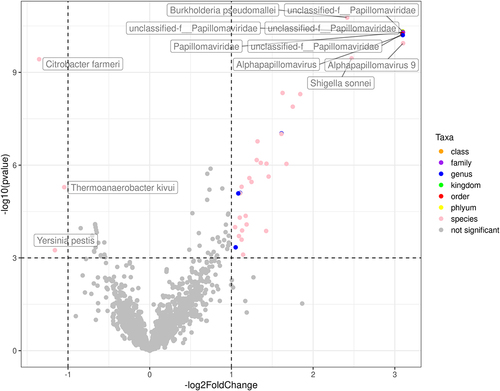
Figure 5. Relative abundance of pertinent immune cell types found in HPV-positive and negative tumors. CD8+ T cells, helper T cells, and naïve B cells were found to be more abundant in HPV-positive tumors. M0 macrophages were more abundant in the HPV-negative tumors.
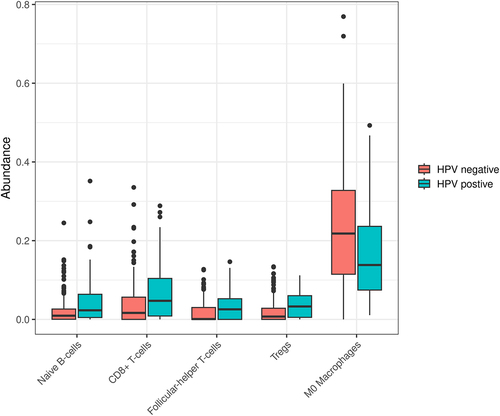
Table S3.xlsx
Download MS Excel (735.6 KB)Table S2.xlsx
Download MS Excel (31.6 KB)Table S5.xlsx
Download MS Excel (105.4 KB)Table S4.xlsx
Download MS Excel (2.4 MB)suppFig2_volcano_differential_gene_expression.png
Download PNG Image (390.8 KB)
suppFig1_exorien_forestplot.png
Download PNG Image (29 KB)
Table S6.xlsx
Download MS Excel (10.9 KB)Table S1.xlsx
Download MS Excel (17.4 KB)suppFig3_hallmark_network_analysis.png
Download PNG Image (1.4 MB)
Data availability statement
The raw RNAseq The Cancer Genome Atlas data were accessed from dbGAP. Microbe counts and the scripts to regenerate all analyses and figures are available from https://github.com/spakowiczlab/exohnscHPV.