
Figures & data
Figure 1. eIf3a was highly expressed in colorectal cancer (CRC). (a) eIF3a mRNA is highly expressed in the peripheral blood of CRC patients (GSE4988); (b) eIf3a mRNA was highly expressed in the tissues of CRC patients (GSE8671, GSE20916); (c) eIf3a mRNA expression in CRC lines (CCLE); (d) eIf3a mRNA expression in HCT116, SW620, HT29, and DLD-1 was higher than that in colonic epithelial cells (HcoEpic), ** p < .01 vs HcoEpic; (e,f) eIf3a protein expression was higher in CRC lines than in HcoEpic, ** p < .01 vs HcoEpic; (g,h) eIf3a was highly expressed in CRC patient tissue, ** p < .01 vs normal.
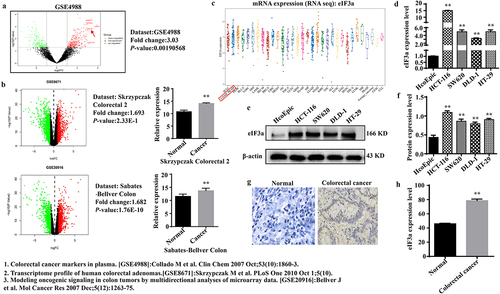
Figure 2. Silencing eIf3a inhibits colorectal cancer (CRC) cell proliferation. (a) eIF3a mRNA expression following si-eIf3a transfection of SW620 and DLD-1 cells was detected using real-time PCR; (b, c) eIf3a protein levels following si-eIf3a transfection were detected via western blotting; (d-f) Cell proliferation following si-eIf3a transfection was determined via MTT (D) and colony formation assay (e, f); (g, h) the apoptosis rate of cells following si-eIf3a transfection was detected using Annexin V-FITC/PI flow cytometry; (i, j) the effect of eIf3a silencing on apoptosis-related proteins was detected via western blot following si-eIf3a transfection. * p < .05, ** p < .01 vs si-NC group.
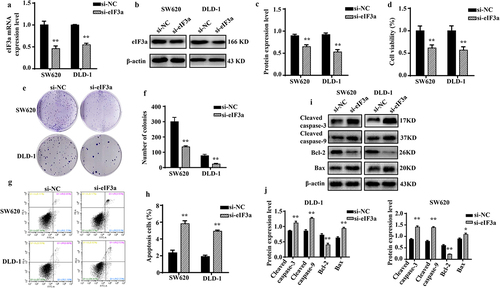
Figure 3. Silencing eIf3a inhibited the EMT of colorectal cancer (CRC) cells. (a, b) the motility of SW620 and DLD-1 cells following si-eIf3a transfection was determined via scratch wound assay; (c, d) the migratory ability of cells following si-eIf3a transfection was determined via Transwell assay; (e, f) the invasive ability of cells following si-eIf3a transfection was determined via Transwell (matrigel) assay; (g, h) EMT-related protein levels following si-eIf3a transfection of cells were detected via western blotting. * p < .05, ** p < .01 vs si-NC group.
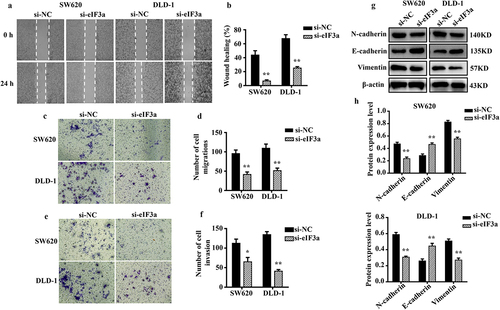
Figure 4. Overexpression of eIf3a inhibited apoptosis and promoted the proliferation of colorectal cancer (CRC) cells. (a) eIF3a mRNA expression levels in h-eIf3a-transfected SW620 and DLD-1 cells were detected using real-time PCR; (b, c) eIf3a protein levels following h-eIf3a transfection were detected via western blotting; (d) Cell proliferation following h-eIf3a transfection was detected using MTT assay; (e, f) the apoptosis rate of cells following h-eIf3a transfection was detected using Annexin V-FITC/PI flow cytometry; (g, h) the expression levels of apoptosis-related proteins following h-eIf3a transfection were detected via western blotting. * p < .05, ** p < .01 vs h-NC group.
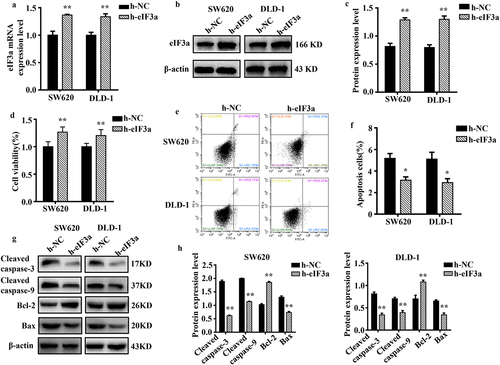
Figure 5. Overexpression of eIf3a promoted the EMT of colorectal cancer (CRC) cells. (a, b) the motility of SW620 and DLD-1 cells following transfection with h-eIf3a was determined via scratch wound assay; (c, d) the migratory ability of cells following transfection with h-eIf3a was determined via Transwell assay; (e, f) the invasive ability of cells following transfection with h-eIf3a was determined via Transwell (matrigel) assay; (g, h) EMT-related protein levels following h-eIf3a transfection were detected via western blotting. * p < .05, ** p < .01 vs h-NC group.
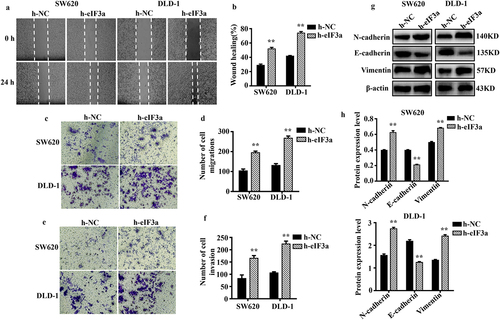
Figure 6. Silencing eIf3a inhibited the growth of colorectal cancer (CRC) in vivo. (a) eIF3a mRNA expression levels in SW620 cells with stably silenced eIf3a was detected using real-time PCR; (b, c) eIf3a expression levels in SW620 cells with stably silenced eIf3a were detected via western blotting; (d) the proliferation of SW620 cells with stably silenced eIf3a was detected via MTT assay; (e) the growth of eIf3a-silenced SW620 ×enograft tumors in nude mice; (f, g) the volume of tumors; (h) eIf3a mRNA expression levels in tumor tissues were detected via real-time PCR; (i, j) eIf3a protein levels in tumor tissues detected via western blotting; (k, l) eIf3a expression in tumor tissues determined via IHC staining. * p < .05, ** p < .01 vs sh-NC group.
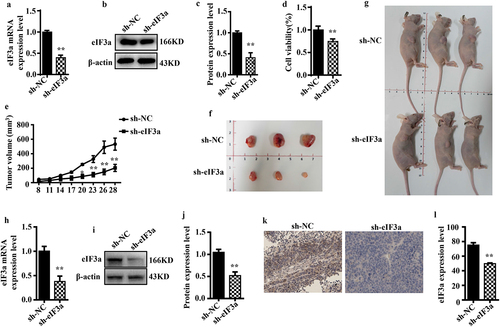
Figure 7. eIf3a affected the activation of PI3K/AKT signaling. (a) ENCORI enrichment analysis of eIf3a-interacting proteins; (b) KEGG pathway enrichment; (c, d) Effect of si-eIf3a in SW620 and DLD-1 cells on PI3K/AKT phosphorylation; (e, f) Effect of eIf3a overexpression in SW620 and DLD-1 cells on PI3K/AKT phosphorylation. * p < .05, ** p < .01 vs si-NC group, # p < .05, ## p < .01 vs h-NC group.
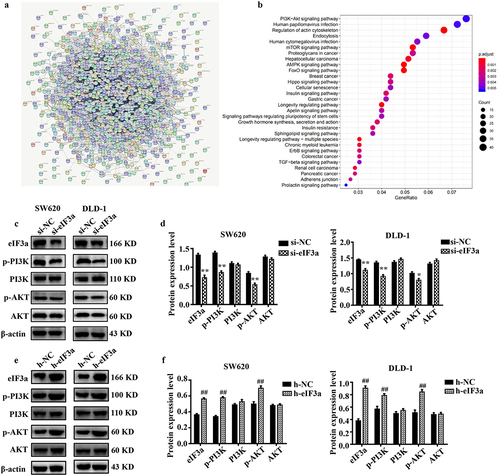
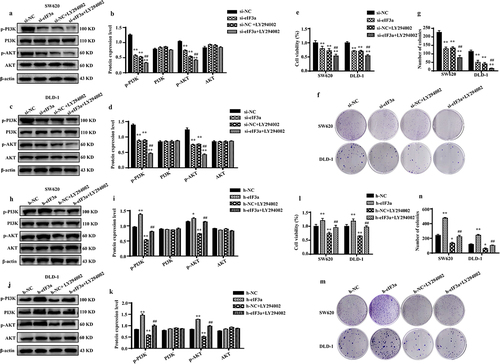
Figure 8. eIf3a activated PI3K/AKT signaling to promote colorectal cancer (CRC) cell proliferation. (a–d) Effect of si-eIf3a and PI3K/AKT-specific inhibitor LY294002 on eIf3a and PI3K/AKT signaling; (e-g) Effect of si-eIf3a and LY294002 on SW620 and DLD-1 cell proliferation; * p < .05, ** p < .01 vs NC group; # p < .05, ## p < .01 vs si-NC+LY294002 group. (h-k) Effect of h-eIf3a and PI3K/AKT signaling pathway-specific inhibitor LY294002 on eIf3a and PI3K/AKT signaling; (l-n) Effect of h-eIf3a and LY294002 on SW620 and DLD-1 cell proliferation. * p < .05, ** p < .01 vs NC group; # p < .05, ## p < .01 vs h-NC+LY294002 group.
Supplemental Material
Download Zip (13.4 MB)Data availability statement
The data used to support the findings of this study are available from the corresponding author upon request.