
Figures & data
Figure 1. P4HA2 expression is upregulated in CRC tumor tissues and related bad clinical outcomes.
(a) A total of 18 pairs CRC tumor and paired normal tissues were used to detect P4HA2 expression by western blotting. Paired t-test was used for statistical analysis. (b) Immunohistochemical analysis of different P4HA2 expression in normal and tumor tissues, and tumor invasion margin. Representative images were shown (magnification: upper panels, 200×; lower panels, 400×). (c) The Mann–Whitney test was used to test the statistical significance of immunoreactive score. (d, e) Kaplan–Meier plots were stratified by P4HA2 protein expression level for overall survival (d) and disease-free survival(e) in CRC patients. Log-rank test was performed to assess the statistical significance.
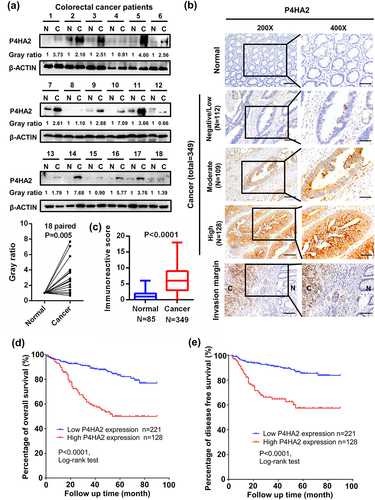
Table 1. Baseline characteristics of patients.
Table 2. Comparison between P4HA2 high and low cases.
Table 3. Relationship between clinicopathological characteristics and OS/DFS.
Figure 2. P4HA2 promotes CRC cell proliferation by regulating cell cycle in vivo and in vitro.
(a) The efficiency of P4HA2 stable knockdown in HCT116 and overexpression in LoVo was detected by western blotting. (b) CCK-8 assay was performed in the indicated HCT116 and LoVo stable cells to detect cell proliferation ability. (c) Colony formation assay in the indicated HCT116 and LoVo stable cells. (d) The percentage of HCT116 stable cells in each cell cycle phase was examined by cell flow cytometry analysis. Two kinds of HCT116-shP4HA2 cells, HCT116-pLKO cells, LoVo-pLVX cells and LoVo-P4HA2 cells were subcutaneous inoculated into nude mice to generate cell derived xenograft model. The mice were randomized, separated into five groups, and injected the above three different cells for 14 days. (e, f) Images of tumor from all groups after injection and the weight of the tumors from the different groups. (g, h) IHC assay was performed to stain KI67 in CDXs from the different groups. Representative images were shown (magnification: upper panels, 200×; lower panels, 400×). *p <.05, **p <.01, ***p <.001, ****p <.0001 by Student’s t-test.
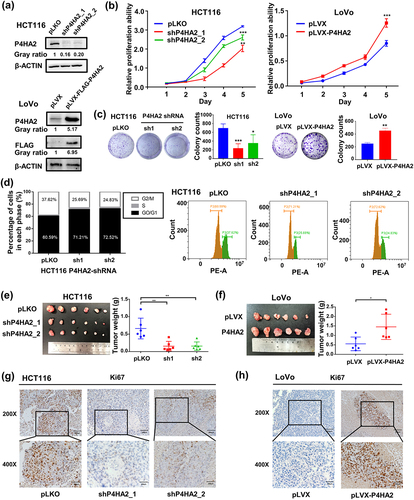
Figure 3. P4HA2 facilitates tumor migration by inducing EMT.
(a) Transwell and wound-healing assays were performed in P4HA2-knockdown and control HCT116 cells to determine the migration ability. (magnification: × 40). (b) Transwell and wound-healing assays were performed in P4HA2-overexpression and control LoVo cells to determine the migration ability. (magnification: × 40) (c, e) Mesenchymal hallmarks N-cadherin and SLUG+SNAIL as well as epithelial hallmark E-cadherin were detected in P4HA2 knockdown HCT116 cells by western blotting (c) and qRT-PCR (e). (d, f) Mesenchymal hallmarks N-cadherin, SLUG+SNAIL and VIMENTIN as well as epithelial hallmark E-cadherin were detected in P4HA2 overexpression LoVo cells by western blotting (d) and qRT-PCR (f). *p<.05, **p<.01, ****p<.0001 by Student’s t-test.
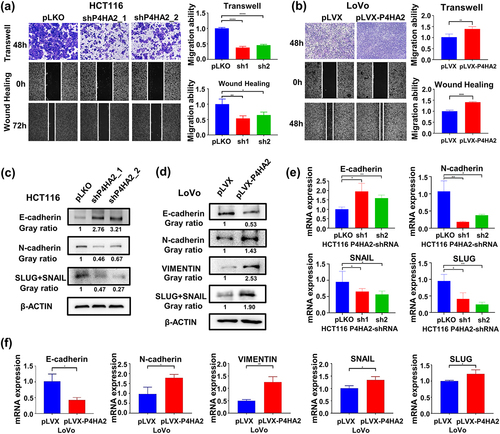
Figure 4. AGO1 mediates the effects of P4HA2 on promoting colorectal cancer progression.
(a) The expression of P4HA2 and AGO1 were detected in the indicated stable LoVo cells by western blotting. (b, c) CCK-8 and colony formation assays were performed in the indicated LoVo stable cells to detect cell proliferation ability. (d) Transwell and wound-healing assays were performed in the indicated LoVo stable cells to determine the migration ability. (magnification: × 40). (e, f) Mesenchymal hallmarks N-cadherin, SLUG+SNAIL and VIMENTIN as well as epithelial hallmark E-cadherin were detected in the indicated LoVo stable cells by western blotting (e) and qRT-PCR (f). (g) Images of tumor from all groups after injecting the indicated LoVo stable cells. The weight of the tumors from the four groups. (h) IHC assay was performed to stain KI67 in CDXs from the four groups. Representative images were shown (magnification: upper panels, 200×; lower panels, 400×). Pearson correlation analysis was used to evaluate the associations. *p<.05, **p<.01, ***p<.001, ****p<.0001 by Student’s t-test.
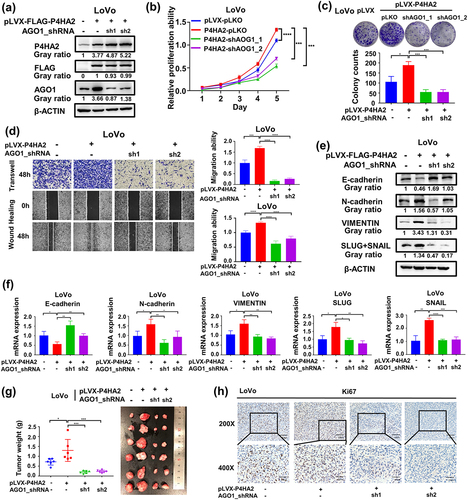
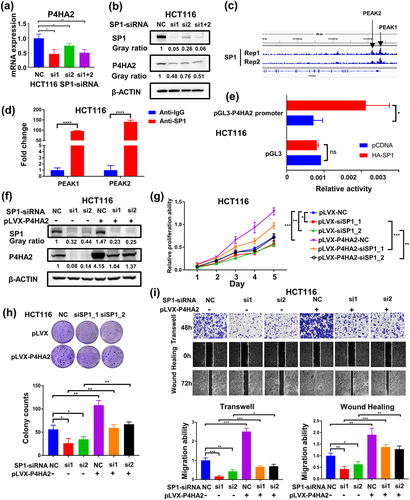
Figure 5. SP1 transcriptionally activates P4HA2 gene expression in colorectal cancer.
(a) The expression of P4HA2 were detected in the SP1 knockdown HCT116 cells by qRT-PCR. (b) The expression of P4HA2 and SP1 were detected in the SP1 knockdown HCT116 cells by western blotting. (c) SP1 binds to the P4HA2 gene locus in two different HCT116 ChIP-seq data sets. (d) Luciferase assay was performed to detect the activation of P4HA2 gene expression by SP1. The P4HA2 promoter regions used for luciferase assay was shown. (e) ChIP-qPCR analysis of SP1 binding to the P4HA2 gene locus in HCT116 cells. Rabbit IgG was used as the negative control. (f) The expression of P4HA2 and SP1 were detected in the indicated HCT116 cells by western blotting. (g, h) CCK-8 assay and colony formation were performed in the indicated HCT116 cells to detect cell proliferation ability. (i) Transwell and wound-healing assays were performed in the indicated HCT116 cells to determine the migration ability. (magnification: × 40). *p<.05, **p<.01, ***p<.001, ****p<.0001 by Student’s t-test.
Supplemental material
Supplementary Table S2 .docx
Download MS Word (17.8 KB)Supplementary Table S1 .docx
Download MS Word (14.8 KB)Data availability statement
The datasets generated during and analyzed during the current study are available from the corresponding author on reasonable request