
Figures & data
Figure 1. Chronic restraint stress promoted tumor growth and weakened the efficacy of bevacizumab.
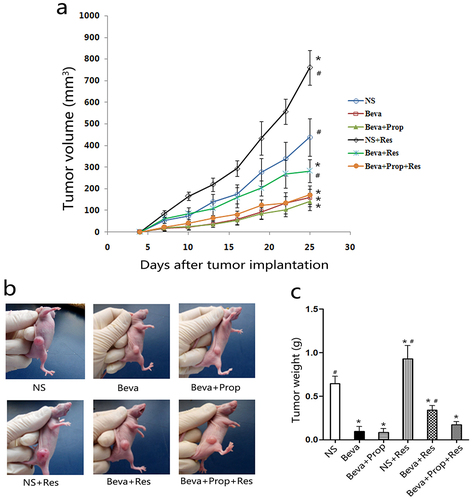
Figure 2. Propranolol inhibited chronic restraint stress-stimulated angiogenesis in vivo.
Figure 3. Chronic restraint stress and norepinephrine induced TGF-β1 secretion.
Figure 4. The mRNA and protein expression of TGF-βRI in HT-29 and SW480 cells after norepinephrine treatment.
Figure 5. Propranolol or Ly2157299 blocked norepinephrine-induced mRNA and protein expression of HIF-1α.
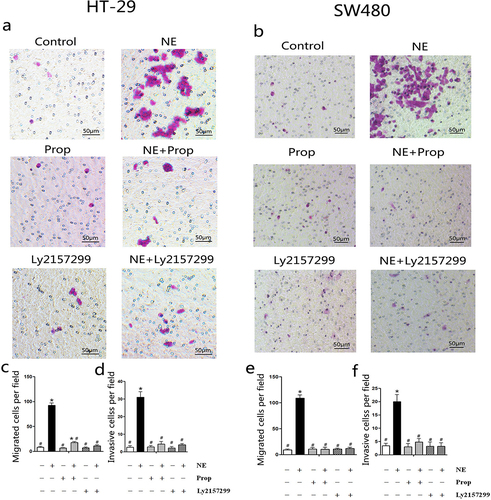
Figure 6. Norepinephrine stimulated HT-29 and SW480 cells migration and invasion.
Data availability statement
The data supporting the findings of this study are available from the corresponding author, JY, upon reasonable request.
The primer sequences used in this study were obtained from the National Center for Biotechnology Information (NCBI): https://www.ncbi.nlm.nih.gov/guide/dna-rna/.