2,554
Views
68
CrossRef citations to date
0
Altmetric
REPORTS

Cordycepin induces cell cycle arrest and apoptosis by inducing DNA damage and up-regulation of p53 in Leukemia cells

, , , , , , , & show all
Pages 761-771 | Received 04 Aug 2014, Accepted 15 Dec 2014, Published online: 06 Mar 2015

Figures & data

Figure 1 (See previous page). Cordycepin induces cell apoptosis in NB-4 and U937 cells. (A) HPLC analysis and UV spectrum of cordycepin purified by HSCCC (left panel). Chemical structure of cordycepin (right panel). (B) Cell viability of NB-4 and U937 cells treated with cordycepin for 24h and 48h at the indicated concentrations. Each data point represents the mean ± SD of triplicate experiments. (C) Morphology characteristic of NB-4 and U937 cells treated with cordycepin. NB-4 cells were treated with 18 μg/mL (71.6 μM) cordycepin for 6 h, 9 h, and 12 h, and U937 cells were treated with 34.5 μg/mL (137.3 μM) cordycepin for 24 h, 36 h, and 48 h. (D) Annexin V analysis of NB-4 and U937 cells treated with cordycepin. NB-4 cells were treated with 18 μg/mL (71.6 μM) cordycepin for 6 h, 9 h, and 12 h, and U937 cells were treated with 34.5 μg/mL (137.3 μM) cordycepin for 24 h, 36 h, and 48 h.
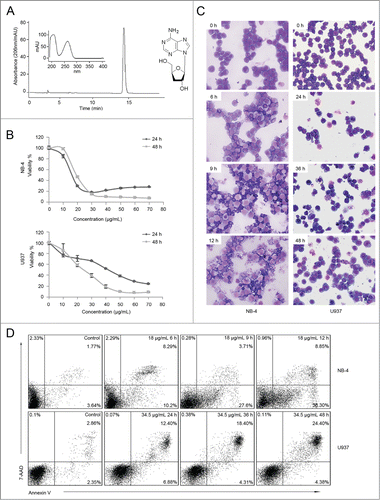
Figure 1 (See previous page). Cordycepin induces cell apoptosis in NB-4 and U937 cells. (A) HPLC analysis and UV spectrum of cordycepin purified by HSCCC (left panel). Chemical structure of cordycepin (right panel). (B) Cell viability of NB-4 and U937 cells treated with cordycepin for 24h and 48h at the indicated concentrations. Each data point represents the mean ± SD of triplicate experiments. (C) Morphology characteristic of NB-4 and U937 cells treated with cordycepin. NB-4 cells were treated with 18 μg/mL (71.6 μM) cordycepin for 6 h, 9 h, and 12 h, and U937 cells were treated with 34.5 μg/mL (137.3 μM) cordycepin for 24 h, 36 h, and 48 h. (D) Annexin V analysis of NB-4 and U937 cells treated with cordycepin. NB-4 cells were treated with 18 μg/mL (71.6 μM) cordycepin for 6 h, 9 h, and 12 h, and U937 cells were treated with 34.5 μg/mL (137.3 μM) cordycepin for 24 h, 36 h, and 48 h.

Figure 2 (See previous page). Cordycepin triggers caspase-dependent apoptosis. (A) NB-4 cells were treated with 18 μg/mL (71.6 μM) cordycepin for 6 h, 9 h and 12 h (upper panel), or treated with 4.5 μg/mL (17.9 μM), 9 μg/mL (35.8 μM), 18 μg/mL (71.6 μM) cordycepin for 12 h (bottom panel). U937 cells were treated with 34.5 μg/mL (137.3 μM) cordycepin for 24 h, 36 h, and 48 h (upper panel), or treated with 11.5 μg/mL (45.8 μM), 23 μg/mL (91.5 μM), 34.5 μg/mL (137.3 μM) cordycepin for 48 h (bottom panel). The extracts from cells were assayed for caspase-3 activity by using colorimetric assay. #, P <0.05 versus 0 h group. *, P<0.01 vs. 0 h group. Each data point represents the mean ± SD of 3 independent experiments. (B) NB-4 cells were treated with 18 μg/mL (71.6 μM) cordycepin for 6 h, 9 h and 12 h, or treated with 4.5 μg/mL (17.9 μM), 9 μg/mL (35.8 μM), 18 μg/mL (71.6 μM) cordycepin for 12 h. U937 cells were treated with 34.5 μg/mL (137.3 μM) cordycepin for 24 h, 36 h, and 48 h, or treated with 11.5 μg/mL (45.8 μM), 23 μg/mL (91.5 μM), 34.5 μg/mL (137.3 μM) cordycepin for 48 h. Whole cell lysates were analyzed by Western blot with the indicated antibodies. s, no specific bands. (C) NB-4 cells were treated with 18 μg/mL (71.6 μM) cordycepin for 6 h, 9 h and 12 h, or treated with 4.5 μg/mL (17.9 μM), 9 μg/mL (35.8 μM), 18 μg/mL (71.6 μM) cordycepin for 12 h. U937 cells were treated with 34.5 μg/mL (137.3 μM) cordycepin for 24 h, 36 h, and 48 h, or treated with or treated with 11.5 μg/mL (45.8 μM), 23 μg/mL (91.5 μM), 34.5 μg/mL (137.3 μM) cordycepin for 48 h. Cytosolic and membrane fractions were generated as described in Materials and Methods. Bax and cytochrome c were detected by Western blot analysis. (D and E) NB-4 cells were preincubated with 80 μM Z-DEVD-fmk for 2 h before treatment with 18 μg/mL (71.6 μM) cordycepin for another 12 h. U937 cells were preincubated with 80 μM Z-DEVD-fmk for 1 h before treatment with 34.5 μg/mL (137.3 μM) cordycepin for another 36 h. Extracts from cells were assayed for caspase-3 activity using a colorimetric assay. *, P<0.01 versus cordycepin treated group. Each data point represents the mean ± SD of 3 independent experiments. Cleavage of PARP was evaluated by Western blot analysis. (F) Annexin V analysis of NB-4 and U937 cells treated with Z-DEVD-fmk and cordycepin. NB-4 cells were preincubated with 80 μM Z-DEVD-fmk for 2 h before treated with 18 μg/mL (71.6 μM) cordycepin for another 12 h. U937 cells were preincubated with 80 μM Z-DEVD-fmk for 1 h before treatment with 34.5 μg/mL (137.3 μM) cordycepin for another 36 h.
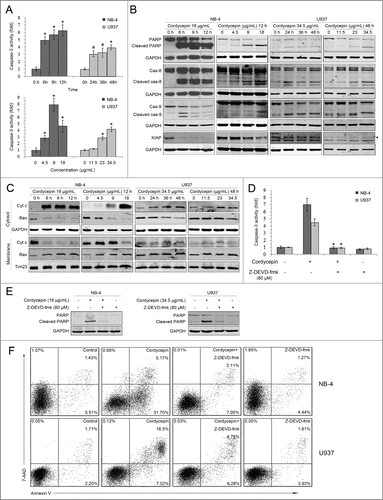
Figure 2 (See previous page). Cordycepin triggers caspase-dependent apoptosis. (A) NB-4 cells were treated with 18 μg/mL (71.6 μM) cordycepin for 6 h, 9 h and 12 h (upper panel), or treated with 4.5 μg/mL (17.9 μM), 9 μg/mL (35.8 μM), 18 μg/mL (71.6 μM) cordycepin for 12 h (bottom panel). U937 cells were treated with 34.5 μg/mL (137.3 μM) cordycepin for 24 h, 36 h, and 48 h (upper panel), or treated with 11.5 μg/mL (45.8 μM), 23 μg/mL (91.5 μM), 34.5 μg/mL (137.3 μM) cordycepin for 48 h (bottom panel). The extracts from cells were assayed for caspase-3 activity by using colorimetric assay. #, P <0.05 versus 0 h group. *, P<0.01 vs. 0 h group. Each data point represents the mean ± SD of 3 independent experiments. (B) NB-4 cells were treated with 18 μg/mL (71.6 μM) cordycepin for 6 h, 9 h and 12 h, or treated with 4.5 μg/mL (17.9 μM), 9 μg/mL (35.8 μM), 18 μg/mL (71.6 μM) cordycepin for 12 h. U937 cells were treated with 34.5 μg/mL (137.3 μM) cordycepin for 24 h, 36 h, and 48 h, or treated with 11.5 μg/mL (45.8 μM), 23 μg/mL (91.5 μM), 34.5 μg/mL (137.3 μM) cordycepin for 48 h. Whole cell lysates were analyzed by Western blot with the indicated antibodies. s, no specific bands. (C) NB-4 cells were treated with 18 μg/mL (71.6 μM) cordycepin for 6 h, 9 h and 12 h, or treated with 4.5 μg/mL (17.9 μM), 9 μg/mL (35.8 μM), 18 μg/mL (71.6 μM) cordycepin for 12 h. U937 cells were treated with 34.5 μg/mL (137.3 μM) cordycepin for 24 h, 36 h, and 48 h, or treated with or treated with 11.5 μg/mL (45.8 μM), 23 μg/mL (91.5 μM), 34.5 μg/mL (137.3 μM) cordycepin for 48 h. Cytosolic and membrane fractions were generated as described in Materials and Methods. Bax and cytochrome c were detected by Western blot analysis. (D and E) NB-4 cells were preincubated with 80 μM Z-DEVD-fmk for 2 h before treatment with 18 μg/mL (71.6 μM) cordycepin for another 12 h. U937 cells were preincubated with 80 μM Z-DEVD-fmk for 1 h before treatment with 34.5 μg/mL (137.3 μM) cordycepin for another 36 h. Extracts from cells were assayed for caspase-3 activity using a colorimetric assay. *, P<0.01 versus cordycepin treated group. Each data point represents the mean ± SD of 3 independent experiments. Cleavage of PARP was evaluated by Western blot analysis. (F) Annexin V analysis of NB-4 and U937 cells treated with Z-DEVD-fmk and cordycepin. NB-4 cells were preincubated with 80 μM Z-DEVD-fmk for 2 h before treated with 18 μg/mL (71.6 μM) cordycepin for another 12 h. U937 cells were preincubated with 80 μM Z-DEVD-fmk for 1 h before treatment with 34.5 μg/mL (137.3 μM) cordycepin for another 36 h.

Figure 3. Effects of cordycepin on p53 and MAPK signaling pathways. (A) NB-4 cells were treated with 18 μg/mL (71.6 μM) cordycepin for 6 h, 9 h and 12 h, or treated with 4.5 μg/mL (17.9 μM), 9 μg/mL (35.8 μM), 18 μg/mL (71.6 μM) cordycepin for 12 h. U937 cells were treated with 34.5 μg/mL (137.3 μM) cordycepin for 24 h, 36 h, and 48 h, or treated with 11.5 μg/mL (45.8 μM), 23 μg/mL (91.5 μM), 34.5 μg/mL (137.3 μM) cordycepin for 48 h. Whole cell lysates were evaluated by Western blot analysis with anti-p53 antibody. (B) NB-4 cells were preincubated with PFT-α for 2 h before treatment with 18 μg/mL (71.6 μM) cordycepin for another 12 h. U937 cells were preincubated with PFT-α for 1 h before treatment with 34.5 μg/mL (137.3 μM) cordycepin for another 48 h. Extracts from cells were assayed for caspase-3/9 activity by using colorimetric assay. #, P <0.05 vs. cordycepin treated group. Each data point represents the mean ± SD of 3 independent experiments. (C) NB-4 cells were preincubated with PFT-α for 2 h before treatment with 18 μg/mL (71.6 μM) cordycepin for another 9 h. U937 cells were preincubated with PFT-α for 1 h before treatment with 34.5 μg/mL (137.3 μM) cordycepin for another 48 h. Whole-cell lysates were analyzed by Western blot with anti-XIAP antibody. (D) NB-4 cells were preincubated with PFT-α for 2 h before treatment with 18 μg/mL (71.6 μM) cordycepin for another 12 h. U937 cells were preincubated with PFT-α for 1 h before treatment with 34.5 μg/mL (137.3 μM) cordycepin for another 48 h. Cytosolic and membrane fractions were generated as described in Materials and Methods. Cytochrome c was detected by Western blot analysis. (E) NB-4 cells were treated with 18 μg/mL (71.6 μM). cordycepin for 6 h, 9 h and 12 h, or treated with 4.5 μg/mL (17.9 μM), 9 μg/mL (35.8 μM), 18 μg/mL (71.6 μM) cordycepin for 12 h. U937 cells were treated with 34.5 μg/mL (137.3 μM) cordycepin for 24 h, 36 h, and 48 h, or treated with 11.5 μg/mL (45.8 μM), 23 μg/mL (91.5 μM), 34.5 μg/mL (137.3 μM) cordycepin for 48 h. Whole cell lysates were evaluated using Western blot analysis with the indicated antibodies.
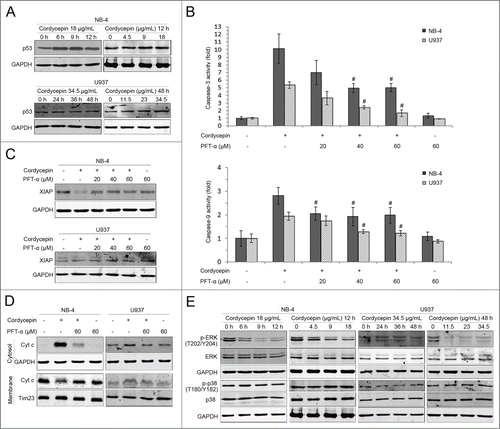
Figure 3. Effects of cordycepin on p53 and MAPK signaling pathways. (A) NB-4 cells were treated with 18 μg/mL (71.6 μM) cordycepin for 6 h, 9 h and 12 h, or treated with 4.5 μg/mL (17.9 μM), 9 μg/mL (35.8 μM), 18 μg/mL (71.6 μM) cordycepin for 12 h. U937 cells were treated with 34.5 μg/mL (137.3 μM) cordycepin for 24 h, 36 h, and 48 h, or treated with 11.5 μg/mL (45.8 μM), 23 μg/mL (91.5 μM), 34.5 μg/mL (137.3 μM) cordycepin for 48 h. Whole cell lysates were evaluated by Western blot analysis with anti-p53 antibody. (B) NB-4 cells were preincubated with PFT-α for 2 h before treatment with 18 μg/mL (71.6 μM) cordycepin for another 12 h. U937 cells were preincubated with PFT-α for 1 h before treatment with 34.5 μg/mL (137.3 μM) cordycepin for another 48 h. Extracts from cells were assayed for caspase-3/9 activity by using colorimetric assay. #, P <0.05 vs. cordycepin treated group. Each data point represents the mean ± SD of 3 independent experiments. (C) NB-4 cells were preincubated with PFT-α for 2 h before treatment with 18 μg/mL (71.6 μM) cordycepin for another 9 h. U937 cells were preincubated with PFT-α for 1 h before treatment with 34.5 μg/mL (137.3 μM) cordycepin for another 48 h. Whole-cell lysates were analyzed by Western blot with anti-XIAP antibody. (D) NB-4 cells were preincubated with PFT-α for 2 h before treatment with 18 μg/mL (71.6 μM) cordycepin for another 12 h. U937 cells were preincubated with PFT-α for 1 h before treatment with 34.5 μg/mL (137.3 μM) cordycepin for another 48 h. Cytosolic and membrane fractions were generated as described in Materials and Methods. Cytochrome c was detected by Western blot analysis. (E) NB-4 cells were treated with 18 μg/mL (71.6 μM). cordycepin for 6 h, 9 h and 12 h, or treated with 4.5 μg/mL (17.9 μM), 9 μg/mL (35.8 μM), 18 μg/mL (71.6 μM) cordycepin for 12 h. U937 cells were treated with 34.5 μg/mL (137.3 μM) cordycepin for 24 h, 36 h, and 48 h, or treated with 11.5 μg/mL (45.8 μM), 23 μg/mL (91.5 μM), 34.5 μg/mL (137.3 μM) cordycepin for 48 h. Whole cell lysates were evaluated using Western blot analysis with the indicated antibodies.

Figure 4 (See previous page). Cordycepin induces cell cycle arrest in NB-4 and U937 cells. (A) Flow cytometric analysis of cell cycle distribution of NB-4 and U937 cells. Cells were treated with or without cordycepin for indicated time and stained with propidium iodide for DNA content. (B) Expression of cyclin A2, cyclin E, and CDK2 mRNAs in NB-4 and U937 cells treated with cordycepin. NB-4 cells were treated with 18 μg/mL (71.6 μM) cordycepin for 6 h, 9 h, and 12 h. U937 cells were treated with 23 μg/mL (91.5 μM) cordycepin for 6 h, 12 h, and 24 h. #, P <0.05 vs. 0 h group. *, P<0.01 versus 0 h group. (C) NB-4 cells were treated with 18 μg/mL (71.6 μM) cordycepin for 6 h, 9 h and 12 h, or treated with 4.5 μg/mL (17.9 μM), 9 μg/mL (35.8 μM), 18 μg/mL (71.6 μM) cordycepin for 12 h. U937 cells were treated with 23 μg/mL (91.5 μM) cordycepin for 12 h, 24 h, and 36 h, or treated with 5.8 μg/mL (23.1 μM), 11.5 μg/mL (45.8 μM), 23 μg/mL (91.5 μM) cordycepin for 36 h. Whole cell lysates were evaluated by Western blot analysis with the indicated antibodies. (D) NB-4 cells were preincubated with PFT-α for 2 h before treatment with 18 μg/mL (71.6 μM) cordycepin for another 9 h. U937 cells were preincubated with PFT-α for 1 h before treatment with 23 μg/mL (91.5 μM) cordycepin for another 36 h. Whole cell lysates were evaluated by Western blot analysis with the indicated antibodies.
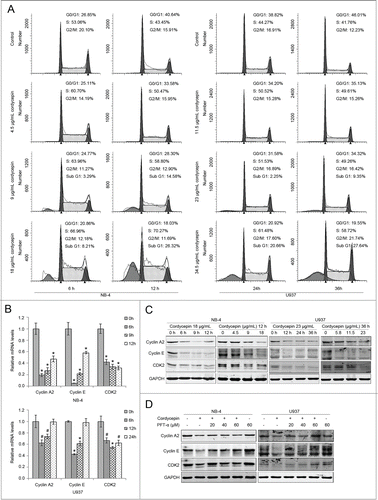
Figure 4 (See previous page). Cordycepin induces cell cycle arrest in NB-4 and U937 cells. (A) Flow cytometric analysis of cell cycle distribution of NB-4 and U937 cells. Cells were treated with or without cordycepin for indicated time and stained with propidium iodide for DNA content. (B) Expression of cyclin A2, cyclin E, and CDK2 mRNAs in NB-4 and U937 cells treated with cordycepin. NB-4 cells were treated with 18 μg/mL (71.6 μM) cordycepin for 6 h, 9 h, and 12 h. U937 cells were treated with 23 μg/mL (91.5 μM) cordycepin for 6 h, 12 h, and 24 h. #, P <0.05 vs. 0 h group. *, P<0.01 versus 0 h group. (C) NB-4 cells were treated with 18 μg/mL (71.6 μM) cordycepin for 6 h, 9 h and 12 h, or treated with 4.5 μg/mL (17.9 μM), 9 μg/mL (35.8 μM), 18 μg/mL (71.6 μM) cordycepin for 12 h. U937 cells were treated with 23 μg/mL (91.5 μM) cordycepin for 12 h, 24 h, and 36 h, or treated with 5.8 μg/mL (23.1 μM), 11.5 μg/mL (45.8 μM), 23 μg/mL (91.5 μM) cordycepin for 36 h. Whole cell lysates were evaluated by Western blot analysis with the indicated antibodies. (D) NB-4 cells were preincubated with PFT-α for 2 h before treatment with 18 μg/mL (71.6 μM) cordycepin for another 9 h. U937 cells were preincubated with PFT-α for 1 h before treatment with 23 μg/mL (91.5 μM) cordycepin for another 36 h. Whole cell lysates were evaluated by Western blot analysis with the indicated antibodies.

Figure 5. Cordycepin induces DNA damage in NB-4 and U937 cells. (A and B) NB-4 cells were treated with 18 μg/mL cordycepin for 6 h, 9 h and 12 h, or treated with 4.5 μg/mL (17.9 μM), 9 μg/mL (35.8 μM), 18 μg/mL (71.6 μM) cordycepin for 12 h. U937 cells were treated with 23 μg/mL (91.5 μM) cordycepin for 6 h, 9 h, and 12 h, or treated with 5.8 μg/mL (23.1 μM), 11.5 μg/mL (45.8 μM), 23 μg/mL (91.5 μM) cordycepin for 12 h. Whole cell lysates were evaluated by Western blot analysis with the indicated antibodies.
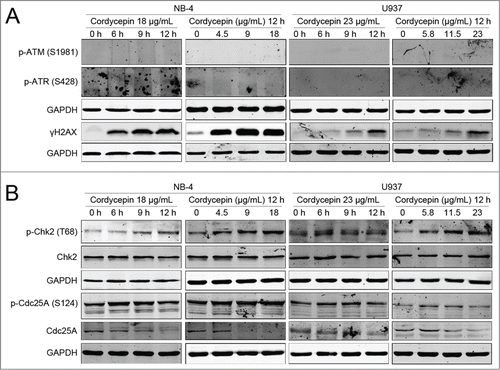
Figure 5. Cordycepin induces DNA damage in NB-4 and U937 cells. (A and B) NB-4 cells were treated with 18 μg/mL cordycepin for 6 h, 9 h and 12 h, or treated with 4.5 μg/mL (17.9 μM), 9 μg/mL (35.8 μM), 18 μg/mL (71.6 μM) cordycepin for 12 h. U937 cells were treated with 23 μg/mL (91.5 μM) cordycepin for 6 h, 9 h, and 12 h, or treated with 5.8 μg/mL (23.1 μM), 11.5 μg/mL (45.8 μM), 23 μg/mL (91.5 μM) cordycepin for 12 h. Whole cell lysates were evaluated by Western blot analysis with the indicated antibodies.

Figure 6. Schematic representation of proposed mechanism of cordycepin-induced apoptosis and cell cycle arrest in NB-4 and U937 cells. In response to cordycepin induced DNA damage, Chk2 is phosphorylated independent of ATM/ATR. The activated Chk2 can then induce ubiquitin-mediated degradation of Cdc25A by phosphorylating Cdc25A on S124. The degradation of Cdc25A leads to the accumulation of CDK2 in its inactive form, and results in the inhibition of DNA synthesis. Cordycepin increases the levels of p53 which repress the expression of cyclin A2, cyclin E, and CDK2, which then cause S-phase arrest. Cordycepin leads to activation of caspase-8 and caspase-9, which then cleave executioner caspase-3. Once activated, caspase-3 cleaves its substrates, such as PARP, and triggers cell apoptosis. The increased levels of p53 can also induce the release of cytochrome c from mitochondria to cytosol promoting the activation of caspase-9. In addition, the expression of anti-apoptotic protein XIAP was inhibited by the upregulation of p53 in NB-4 cells, while the levels of XIAP were not affected in U937 cells. Cordycepin also inhibits the phosphorylation of ERK1/2, and blocks the activation of MAPK pathway. The blockage of MAPK signaling therefore sensitizes cordycepin-induced cell apoptosis.
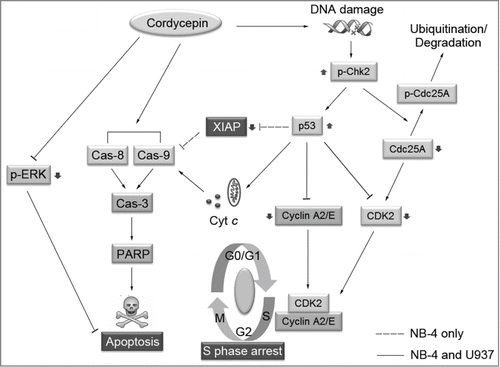
Figure 6. Schematic representation of proposed mechanism of cordycepin-induced apoptosis and cell cycle arrest in NB-4 and U937 cells. In response to cordycepin induced DNA damage, Chk2 is phosphorylated independent of ATM/ATR. The activated Chk2 can then induce ubiquitin-mediated degradation of Cdc25A by phosphorylating Cdc25A on S124. The degradation of Cdc25A leads to the accumulation of CDK2 in its inactive form, and results in the inhibition of DNA synthesis. Cordycepin increases the levels of p53 which repress the expression of cyclin A2, cyclin E, and CDK2, which then cause S-phase arrest. Cordycepin leads to activation of caspase-8 and caspase-9, which then cleave executioner caspase-3. Once activated, caspase-3 cleaves its substrates, such as PARP, and triggers cell apoptosis. The increased levels of p53 can also induce the release of cytochrome c from mitochondria to cytosol promoting the activation of caspase-9. In addition, the expression of anti-apoptotic protein XIAP was inhibited by the upregulation of p53 in NB-4 cells, while the levels of XIAP were not affected in U937 cells. Cordycepin also inhibits the phosphorylation of ERK1/2, and blocks the activation of MAPK pathway. The blockage of MAPK signaling therefore sensitizes cordycepin-induced cell apoptosis.
Supplemental material

1000097_Supplementary_Materials.zip

Download Zip (230.3 KB)

Reprints and Corporate Permissions

Please note: Selecting permissions does not provide access to the full text of the article, please see our help page How do I view content?

To request a reprint or corporate permissions for this article, please click on the relevant link below:

Academic Permissions

Please note: Selecting permissions does not provide access to the full text of the article, please see our help page How do I view content?

Obtain permissions instantly via Rightslink by clicking on the button below:

If you are unable to obtain permissions via Rightslink, please complete and submit this Permissions form. For more information, please visit our Permissions help page.