Figures & data
Figure 1. Instability and differentiation of Mad2l2−/− ESCs in LIF/serum. (A) RT-qPCR analysis of Mad2l2 and Nanog mRNA in ESCs and differentiating embryoid bodies (EBs). Representative data of 3 replicates are shown, (B) Western blot analysis of Mad2l2 and Nanog protein expression in ESCs and differentiating EBs. Representative data of 3 replicates are shown. (C) Phase contrast images and their corresponding Oct4-GFP expressions in heterozygous control (CTRL) versus Mad2l2−/− ESCs. Red arrows point to Oct4-GFP negative epithelial differentiating cells in Mad2l2−/− ESC cultures grown in LIF /serum medium; see also the Figure S1A for other knockout line. (D) Immunofluorescent staining of CTRL and Mad2l2−/− ESCs grown in LIF /serum with antibodies against Oct4 and Nanog. Note that differentiating cells in the periphery of a Mad2l2−/− colony lack expression of Nanog and Oct4 and undifferentiated cells at the center of Mad2l2−/− colony expressed Nanog only poorly. Scale bar 25 μm. See also Figure S1C. (E) RT-qPCR analysis of pluripotency-associated gene expression in 3 independent knockout ESC lines in comparison to CTRL ESCs grown in LIF /serum. Expression levels were normalized to Gapdh and then to a heterozygous ESC line as control. The error bar represents the mean ± SEM. (F) Mad2l2−/− ESCs grown in LIF/serum fail to generate chimeric pups. A representative picture of 5 different litters obtained from embryo injection of each cell line is shown. The same result was observed in the injection of 2 other knockout lines (Table S4 and data not shown).
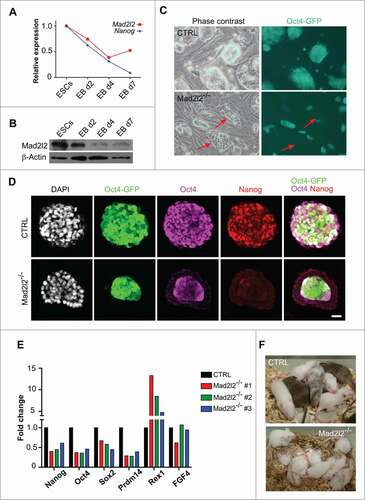
Figure 2. Mad2l2−/− ESCs deviate into primitive endoderm in LIF/serum. (A) RT-qPCR analysis of differentiation markers in 3 independent knockout ESC lines grown in LIF/serum in comparison to CTRL ESCs. Expression levels were normalized to Gapdh and then to a heterozygous ESC line as control. The error bar represents the mean ± SEM. Immunocytochemistry demonstrates expression of Sox17 (B) and Gata4 (C) in the differentiating cells at the periphery of Mad2l2−/− ESC colonies (LIF/serum). Scale bar, 20 μM. (D) Mad2l2−/− ESCs were infected with lentiviral particles allowing for Mad2l2 expression under the control of doxycycline (Dox) as described in the material section. Note the reduced level of Gata4 and Sox17 in ESCs grown in LIF/serum/ doxycycline, while levels of Rex 1 remained unaffected.
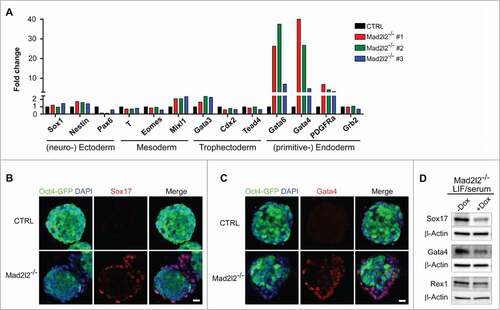
Figure 3. Adaptation of Mad2l2−/− ESC culture to LIF/2i inhibits differentiation. (A) Upon shifting from LIF/serum to LIF/2i, and further adaptation for 2–3 passages, differentiating cells in Mad2l2−/− culture disappear (red arrow in the left panel). (B) Western blot analysis of unsorted cells from LIF/serum culture (lanes #1 and 2), of FACS-sorted, Oct4-GFP positive cells from LIF/serum culture (lanes #3 and 4), and of LIF/2i-adapted ESCs (lanes #5 and 6). (C) Western blot analysis of pluripotency-related markers in ESCs from LIF/2i cultures. (D) LIF/2i-adapted Mad2l2−/− ESCs re-acquire the potential to generate chimeric pups (red arrow). A representative picture of 3 different litters obtained from embryo injection of each cell line is shown. (E) Western blot analysis of Oct4-GFP positive ESCs from LIF/serum cultures treated with the small molecule inhibitors CHIR 99021 (CH) and/or PD 0325901 (PD). Note that inhibition of the MAPK pathway by PD is sufficient to block primitive endoderm differentiation in Mad2l2−/− ESCs. (B–E) are the representative images of at least 3 independent biological replicates.
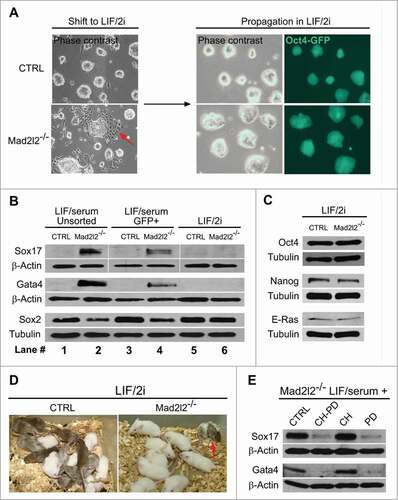
Figure 4 (See previous page). Genome-wide analysis of gene expression in LIF/2i Mad2l2−/− ESCs. (A) Identification of differentially expressed genes via R-package goseq from RNA-Seq experiments. The top 10 of 308 significantly enriched GO terms for the differentially expressed genes in Mad2l2−/− and CTRL ESCs are selected. Intriguingly, MAPK cascade gene ontology (GO) terms ′′regulation of MAPK cascade,′′ ′′positive regulation of MAPK cascade,′′ ′′regulation of fibroblast growth factor receptor signaling pathway,′′ and ′′fibroblast growth factor receptor signaling pathway′′ were also enriched (see Table S6). Normalization of counts and testing for differential expression were calculated via R-package DESeq. (B) Scatter plot of pluripotency-associated (in red) and differentially expressed MAPK transcripts (in blue). Normalized counts as CPM (counts per million mapped reads) were calculated via DESeq. Some genes associated to ′′regulation of MAPK cascade′′ are depicted. Pluripotency-associated genes are not differentially expressed except for Zfp42 (Rex1). (C) RT-qPCR analysis of gene expression for selected MAPK transcripts confirmed differential expressions seen by RNA sequencing. Note that positive components of the MAPK pathway are increased, whereas negative regulators such as the 3 dual specificity phosphatases are decreased in Mad2l2−/− ESCs. (D) Western blot analysis showed increased phosphorylation of Erk1/2 (pErk1/2) and JNK (pJNK1/2) proteins in LIF/serum Mad2l2−/− ESCs. The image is a representative of at 3 independent biological replicates of knockout line. (E) Western blot analysis of pErk1/2 levels upon short-term exposure of ESCs to FGF4 (3 ng/ml).Citation21 Note the earlier and stronger elevation of pErk1/2 in Mad2l2−/− samples upon stimulation by FGF4. (F) Left: western blotting for Sox17 and Gata4 primitive endoderm markers upon a continued exposure of ESCs to FGF4. In Mad2l2−/− ESCs, these markers were prominently upregulated already on day 3, while CTRL ESCs were refractory to differentiation even after 5 d. Right: a representative overlay (phase contrast and Oct4-GFP expression) of CTRL and Mad2l2−/− ESCs after 3 d of stimulation by FGF4 showed re-appearance of epithelial-like Oct4-GFP negative differentiating cells in knockout culture. (E and F), are the representative images of at least 3 independent biological replicates of FGF4 treatment of the Mad2l2 knockout line.
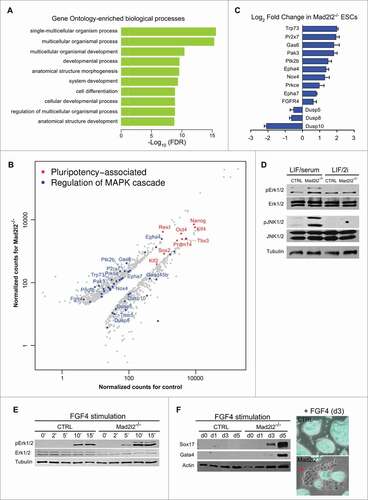
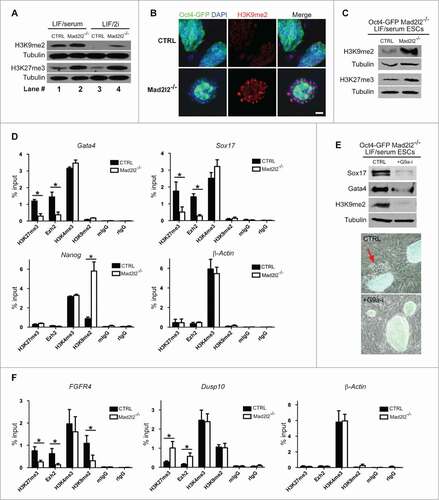
Figure 5 (See previous page). Epigenetic signature of Mad2l2 deficient cells. (A) Western blot analysis of histone modifications in CTRL and Mad2l2−/− ESCs in LIF/serum and LIF/2i culture conditions. Note to the consistent upregulation of histone marks in knockout cells. The image shows a representative blot of 3 independent biological samples of knockout line. (B) A representative immunocytochemistry analysis of H3K9me2 levels in ESCs. Differentiating Oct4-GFP negative cells in the periphery of Mad2l2−/− colonies harbor high levels of H3K9me2. Scale bar, 25 μm. (C) A representative protein gel blot analysis of histone modification in CTRL and Mad2l2−/− ESCs in FACS sorted Oct4-GFP positive ESCs from LIF/serum culture. Note the consistent upregulation of methylated histone 3 in knockout cells. (D) ChIP analysis of H3K27me3, Ezh2, and H3K9me2 deposition on Gata4, Sox17 and Nanog promoters in Oct4-GFP positive LIF/serum ESCs. 1% of pre-cleared sonicated chromatin was used as input. As the negative controls, mIgG, Normal mouse IgG, and rIgG, Normal rabbit IgG were used. ChIP analysis of β-Actin promoter shows no difference of histone marks between knockout and control LIF/serum ESCs. (E) Upper panel: G9a-inhibition hampers PrE differentiation of Mad2l2−/− ESCs as indicated by decreased levels of Sox17, Gata4 in western blot analysis. FACS sorted Oct4-GFP positive LIF/serum Mad2l2−/− ESCs were plated on fresh inactivated MEFs and treated for 4–5 d in LIF/serum (CTRL) or LIF/serum supplemented with G9a-inhibitor BIX01294 (+G9a-i). A significant decrease in H3K9me2 level confirms effective inhibition of G9a. Lower panel: The representative phase contrast and Oct4-GFP overlay of the cultures used for protein gel blotting. The red arrow points to the epithelial-like Oct4-GFP negative differentiated cells emerged in LIF/serum culture (CTRL) of Mad2l2−/− ESCs. (F) ChIP analysis of H3K27me3, Ezh2, and H3K9me2 deposition on FGFR4 and Dusp10 promoters in LIF/2i ESCs. 1% of pre-cleared sonicated chromatin was used as input. As the negative controls, mIgG, Normal mouse IgG, and rIgG, Normal rabbit IgG were used. ChIP analysis of β-Actin promoter shows no difference of histone marks between knockout and control LIF/2i ESCs. In (D and F), error bars represent mean ± SEM of 3 independent ChIPs. *,P< 0.05; paired Student's t test.