846
Views
9
CrossRef citations to date
0
Altmetric
Report

Mitogenic signaling pathways in the liver of growth hormone (GH)-overexpressing mice during the growth period

, , , , , , & show all
Pages 748-759 | Received 18 Dec 2015, Accepted 21 Jan 2016, Published online: 30 Mar 2016

Figures & data

Table 1. Body and liver weight in growing GH-overexpressing mice and normal littermates.

Figure 1. Histological analysis of livers from growing GH-overexpressing transgenic mice and normal littermates. A: Representative photomicrographs of hematoxylin and eosin staining of liver sections from normal and GH-transgenic male mice. B: Hepatocyte quantification in female mice. C: Hepatocyte quantification in male mice. Hepatocyte size of GH-transgenic animals (T) and their non-transgenic littermates (N) was assessed for 2-week-old (2w), 4-week-old (4w) and 9-week-old (9w) mice. Hepatocyte size was estimated counting the number of cells per visual field; original magnification of 400x. Data are the mean ± SEM of 8 sets of different individuals per group. Different letters denote significant difference by age within a genotype; small letters correspond to normal mice and capital letters to transgenic animals. Asterisks indicate significant difference between GH-overexpressing animals and their corresponding non-transgenic age controls.
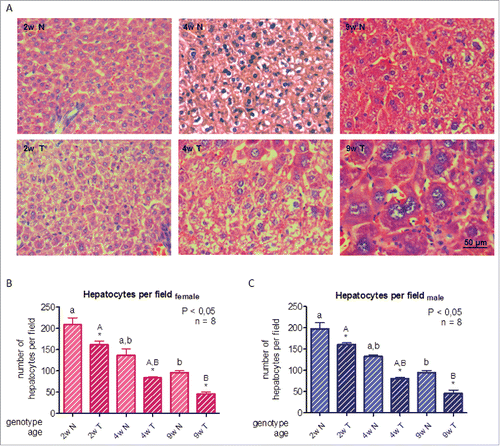
Figure 1. Histological analysis of livers from growing GH-overexpressing transgenic mice and normal littermates. A: Representative photomicrographs of hematoxylin and eosin staining of liver sections from normal and GH-transgenic male mice. B: Hepatocyte quantification in female mice. C: Hepatocyte quantification in male mice. Hepatocyte size of GH-transgenic animals (T) and their non-transgenic littermates (N) was assessed for 2-week-old (2w), 4-week-old (4w) and 9-week-old (9w) mice. Hepatocyte size was estimated counting the number of cells per visual field; original magnification of 400x. Data are the mean ± SEM of 8 sets of different individuals per group. Different letters denote significant difference by age within a genotype; small letters correspond to normal mice and capital letters to transgenic animals. Asterisks indicate significant difference between GH-overexpressing animals and their corresponding non-transgenic age controls.
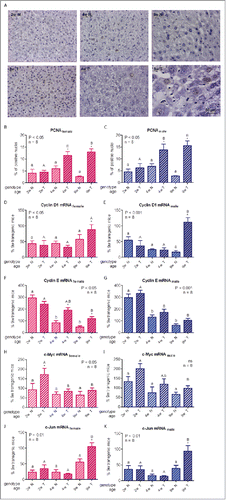
Figure 2. For figure legend, see next page. Hepatocellular proliferation markers in growing GH-overexpressing transgenic mice and normal littermates. A: Representative photomicrographs of immunohistochemical staining of liver sections from normal and GH-transgenic male mice with anti-PCNA antibody; original magnification of 400x. B,C: PCNA immunostaining quantification in female and male mice liver respectively. D,E: Cyclin D1 mRNA hepatic expression in female and male mice. F,G: Cyclin E mRNA hepatic expression in female and male mice. H,I: c-Myc mRNA hepatic expression in female and male mice. J,K: c-Jun mRNA hepatic expression in female and male mice. Different cell cycle regulators and transcription factors involved in cellular proliferation were assessed in liver of GH-transgenic animals (T) and their non-transgenic littermates (N) for 2-week-old (2w), 4-week-old (4w) and 9-week-old (9w) mice. PCNA content was calculated as percentage of positive (brown stained) nuclei in 500 cells approximately. For simplification, only pictures from males are shown (A). To determine gene expression, mRNA was assessed by RT-qPCR from total RNA extracts. Values were related to cyclophilin A levels, referred to the average for 9-week-old transgenic female and male mice and expressed as percentage. Data are the mean ± SEM of the indicated n number of samples per group, each one representing a different animal. Different letters denote significant difference by age within genotype; small letters correspond to normal mice and capital letters to transgenic animals. Asterisks indicate significant difference between GH-overexpressing animals and their corresponding non-transgenic age controls.

Figure 2. For figure legend, see next page. Hepatocellular proliferation markers in growing GH-overexpressing transgenic mice and normal littermates. A: Representative photomicrographs of immunohistochemical staining of liver sections from normal and GH-transgenic male mice with anti-PCNA antibody; original magnification of 400x. B,C: PCNA immunostaining quantification in female and male mice liver respectively. D,E: Cyclin D1 mRNA hepatic expression in female and male mice. F,G: Cyclin E mRNA hepatic expression in female and male mice. H,I: c-Myc mRNA hepatic expression in female and male mice. J,K: c-Jun mRNA hepatic expression in female and male mice. Different cell cycle regulators and transcription factors involved in cellular proliferation were assessed in liver of GH-transgenic animals (T) and their non-transgenic littermates (N) for 2-week-old (2w), 4-week-old (4w) and 9-week-old (9w) mice. PCNA content was calculated as percentage of positive (brown stained) nuclei in 500 cells approximately. For simplification, only pictures from males are shown (A). To determine gene expression, mRNA was assessed by RT-qPCR from total RNA extracts. Values were related to cyclophilin A levels, referred to the average for 9-week-old transgenic female and male mice and expressed as percentage. Data are the mean ± SEM of the indicated n number of samples per group, each one representing a different animal. Different letters denote significant difference by age within genotype; small letters correspond to normal mice and capital letters to transgenic animals. Asterisks indicate significant difference between GH-overexpressing animals and their corresponding non-transgenic age controls.

Figure 3. For figure legend, see next page. Src and STAT3 signaling in liver of growing GH-overexpressing mice and normal littermates. A,B: Src phosphorylation at tyrosine 416 in female and male mice. C,D: Src protein abundance in female and male mice. E,F: STAT3 phosphorylation at tyrosine 705 in female and male mice. G,H: STAT3 protein abundance in female and male mice. I: STAT3 liver immunohistochemical staining in male adult mice. Signaling mediators were assessed in liver of GH-transgenic animals (T) and their non-transgenic littermates (N) for 2-week-old (2w), 4-week-old (4w) and 9-week-old (9w) mice. To determine phosphorylation and protein abundance, equal amounts of solubilized liver protein were assessed by immunoblotting. Representative immunoblots (IB) as well as Coomassie blue staining (CBS) of PVDF membranes are shown. Bands were quantified by scanning densitometry. Results were expressed as percentage, referred to the average for 9-week-old transgenic female and male mice. Data are the mean ± SEM of the indicated n number of samples per group, each one representing a different animal. Different letters denote significant difference by age within genotype; small letters correspond to normal mice and capital letters to transgenic animals. Asterisks indicate significant difference between GH-overexpressing animals and their corresponding non-transgenic age controls. Number sign indicates significant difference between sexes. Arrows show the quantified band. For IHC analysis (Panel I), representative photomicrographs of immunohistochemical staining with anti-STAT3 antibody of liver sections from normal and GH-transgenic male adult mice is shown. Positive nuclei are shown with black arrows and negative ones with gray arrows.
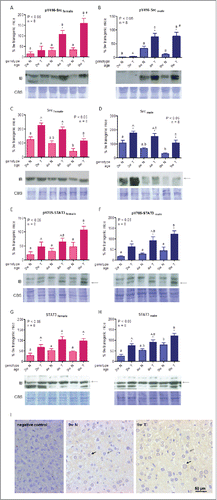
Figure 3. For figure legend, see next page. Src and STAT3 signaling in liver of growing GH-overexpressing mice and normal littermates. A,B: Src phosphorylation at tyrosine 416 in female and male mice. C,D: Src protein abundance in female and male mice. E,F: STAT3 phosphorylation at tyrosine 705 in female and male mice. G,H: STAT3 protein abundance in female and male mice. I: STAT3 liver immunohistochemical staining in male adult mice. Signaling mediators were assessed in liver of GH-transgenic animals (T) and their non-transgenic littermates (N) for 2-week-old (2w), 4-week-old (4w) and 9-week-old (9w) mice. To determine phosphorylation and protein abundance, equal amounts of solubilized liver protein were assessed by immunoblotting. Representative immunoblots (IB) as well as Coomassie blue staining (CBS) of PVDF membranes are shown. Bands were quantified by scanning densitometry. Results were expressed as percentage, referred to the average for 9-week-old transgenic female and male mice. Data are the mean ± SEM of the indicated n number of samples per group, each one representing a different animal. Different letters denote significant difference by age within genotype; small letters correspond to normal mice and capital letters to transgenic animals. Asterisks indicate significant difference between GH-overexpressing animals and their corresponding non-transgenic age controls. Number sign indicates significant difference between sexes. Arrows show the quantified band. For IHC analysis (Panel I), representative photomicrographs of immunohistochemical staining with anti-STAT3 antibody of liver sections from normal and GH-transgenic male adult mice is shown. Positive nuclei are shown with black arrows and negative ones with gray arrows.

Figure 4. ERK and Akt signaling in liver of growing GH-overexpressing mice and normal littermates. A,B: ERK- phosphorylation at threonine 202 and tyrosine 204 in female and male mice. C,D: ERK protein abundance in female and male mice. E,F: Akt phosphorylation at serine 473 in female and male mice. G,H: Akt protein abundance in female and male mice. I,J: GSK3 phosphorylation at serine 9 in female and male mice. K,L: GSK3 protein abundance in female and male mice. M,N: mTOR phosphorylation at serine 2448 in female and male mice. O,P: mTOR protein abundance in female and male mice. Signaling mediators were assessed in liver of GH-transgenic animals (T) and their non-transgenic littermates (N) for 2-week-old (2w), 4-week-old (4w) and 9-week-old (9w) mice. Equivalent amounts of solubilized tissue were analyzed by immunoblotting. Representative immunoblots (IB) as well as Coomassie blue staining (CBS) of PVDF membranes are shown. Bands were quantified by scanning densitometry. Values were expressed as percentage, referred to the average for 9-week-old transgenic female and male mice. Data are the mean ± SEM of the indicated n number of samples per group, each one representing a different animal. Different letters denote significant difference by age within genotype; small letters correspond to normal mice and capital letters to transgenic animals. Asterisks indicate significant differences between GH-overexpressing animals and their corresponding non-transgenic age controls; ns stands for non-significant. Number sign indicates significant difference between sexes. Arrows indicate the quantified bands.
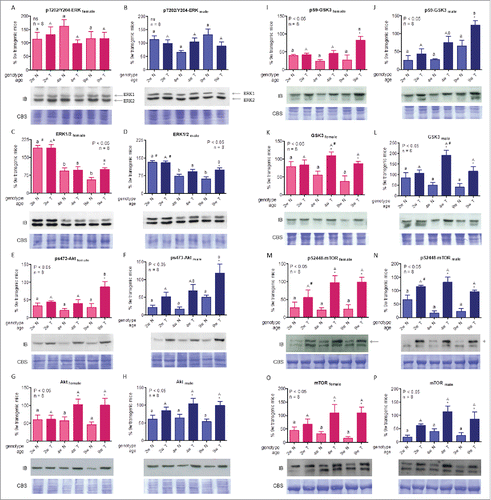
Figure 4. ERK and Akt signaling in liver of growing GH-overexpressing mice and normal littermates. A,B: ERK- phosphorylation at threonine 202 and tyrosine 204 in female and male mice. C,D: ERK protein abundance in female and male mice. E,F: Akt phosphorylation at serine 473 in female and male mice. G,H: Akt protein abundance in female and male mice. I,J: GSK3 phosphorylation at serine 9 in female and male mice. K,L: GSK3 protein abundance in female and male mice. M,N: mTOR phosphorylation at serine 2448 in female and male mice. O,P: mTOR protein abundance in female and male mice. Signaling mediators were assessed in liver of GH-transgenic animals (T) and their non-transgenic littermates (N) for 2-week-old (2w), 4-week-old (4w) and 9-week-old (9w) mice. Equivalent amounts of solubilized tissue were analyzed by immunoblotting. Representative immunoblots (IB) as well as Coomassie blue staining (CBS) of PVDF membranes are shown. Bands were quantified by scanning densitometry. Values were expressed as percentage, referred to the average for 9-week-old transgenic female and male mice. Data are the mean ± SEM of the indicated n number of samples per group, each one representing a different animal. Different letters denote significant difference by age within genotype; small letters correspond to normal mice and capital letters to transgenic animals. Asterisks indicate significant differences between GH-overexpressing animals and their corresponding non-transgenic age controls; ns stands for non-significant. Number sign indicates significant difference between sexes. Arrows indicate the quantified bands.

Reprints and Corporate Permissions

Please note: Selecting permissions does not provide access to the full text of the article, please see our help page How do I view content?

To request a reprint or corporate permissions for this article, please click on the relevant link below:

Academic Permissions

Please note: Selecting permissions does not provide access to the full text of the article, please see our help page How do I view content?

Obtain permissions instantly via Rightslink by clicking on the button below:

If you are unable to obtain permissions via Rightslink, please complete and submit this Permissions form. For more information, please visit our Permissions help page.