Figures & data
Figure 1. BCL6 expression and localization in trophoblastic cell lines. (A) Trophoblastic cell lines JAR, BeWo and HTR were harvested for Western blot analysis using antibody against BCL6. B-cell lymphoma cell line Raji was taken as positive control for BCL6. β-actin served as loading control. (B) Relative amount of the BCL6 gene in trophoblastic cells. The results are presented by mean ± SD. RQ: relative quantification by setting the BCL6 value in JAR cells as 1, as described in Materials and Methods. Raji was taken as positive control for BCL6. (C) Subcellular localization of BCL6 in trophoblastic cells. Cells were stained for BCL6, centrosome marker pericentrin, microtubule marker α-tubulin and DNA. Scale bar: 5 µm.
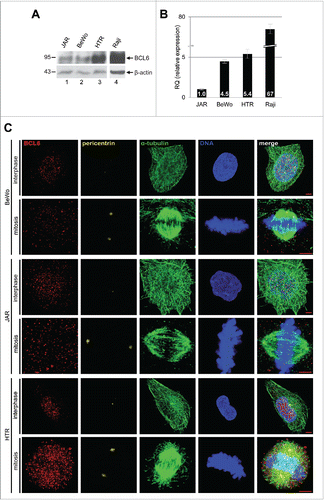
Figure 2. Suppression of BCL6 inhibits proliferation of trophoblasts. (A) Cell viability of HTR cells depleted of BCL6. HTR cells were treated with control siRNA (si con) or siRNA targeting BCL6 (si BCL6) and cultured for indicated time periods for evaluating cell viability. Non-treated HTR cells were taken as control (con). The results are presented as mean ± SD and statistically analyzed relative to control siRNA treated HTR cells. *p < 0.05. (B) Western blot analysis. HTR cells were treated as described in (A) and harvested for Western blot analyses with indicated antibodies. β-actin served as loading control. (C) Cell viability of JAR cells depleted of BCL6. JAR cells were treated as described in (A). The results are presented as mean ± SD and statistically analyzed relative to control siRNA treated JAR cells. *p < 0.05; **p < 0.01. (D) Cell viability of BeWo cells depleted of BCL6. Cells were treated as in (A). The results are presented as mean ± SD. (E-H) BCL6 inhibitor 79–6 suppresses proliferation of HTR (E), JAR (F), BeWo (G) and Raji cells (H). Cells were treated with 79–6 at indicated concentrations and harvested at indicated time points for evaluation of cell viability. The results are presented as mean ± SD and statistically analyzed relative to control cells treated with DMSO. *p < 0.05; **p < 0.01; ***p < 0.001. B-cell lymphoma Raji cells were taken as control.
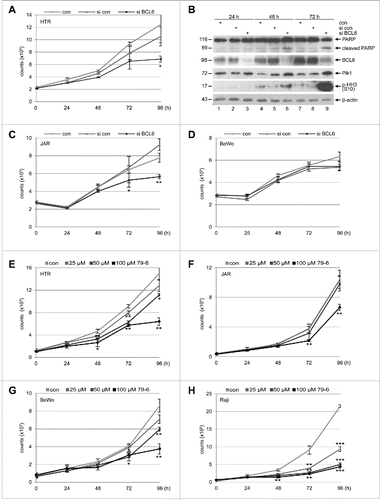
Figure 3. BCL6 suppression induces a mitotic arrest. (A) HTR cells were non-treated (con), treated with control siRNA (si con) or siRNA targeting BCL6 (si BCL6) for 72 h and harvested for cell cycle analysis. Cell cycle profiles are presented. (B) Cell cycle distribution was evaluated with the CellQuest software. (C) Treated HTR cells were also stained with p-HH3 (S10) for FACS analysis. The percentages of positive cells are presented. (D) Western blot analysis. β-actin served as loading control. (E-J) The mRNA levels of important mitotic regulators in HTR cells deficient of BCL6. HTR cells were treated with control siRNA (si con) or siRNA targeting BCL6 (si BCL6) for 48 h. Total RNAs were isolated for real-time PCR analysis. The results of Plk1 (E), Aurora B (F), survivin (G), cyclin B1 (H), p21 (I) and p53 (J) are based on 3 independent experiments and presented as mean ± SEM. **p < 0.01. The RQ value of the control siRNA treated cells was defined as 1-fold.
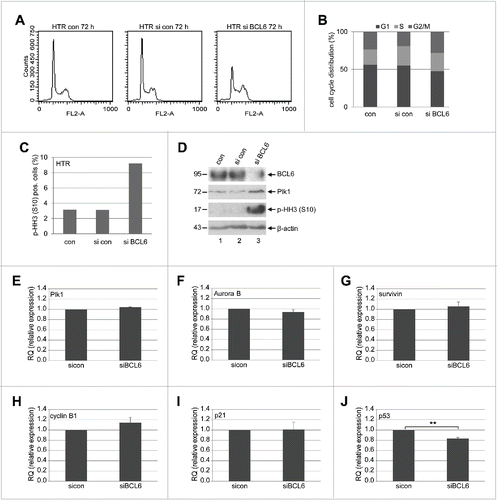
Figure 4. Reduced sister centromere distance and increased centrosome fragmentation upon depletion of BCL6. (A) HTR cells were treated with control siRNA (si con) or siRNA targeting BCL6 (si BCL6) for 48 h and stained for pericentrin, anti-centromere antibody (ACA), α-tubulin and DNA. Representatives are shown. Scale bar: 5 µm. Insets: 10 time amplified ACA staining. (B) The distance of the sister centromere was measured (60 pairs for each condition) and the results are presented as mean ± SD. **p < 0.01. (C) Control Western blot analysis for (A) and (B) with antibody against BCL6. β-actin served as loading control. (D) Control Western blot analysis with antibody against BCL6 for (E) and (F). β-actin served as loading control. (E) HTR cells were treated as in (A) and stained for pericentrin, γ-tubulin, α-tubulin and DNA. The numbers of cells with fragmented centrosome(s) were evaluated (100 metaphase cells for each condition). The results are based on 3 independent experiments and presented as mean ± SEM. **p < 0.01. (F) Examples are shown. White arrows: fragmented centrosomes. Scale bar: 5 µm.
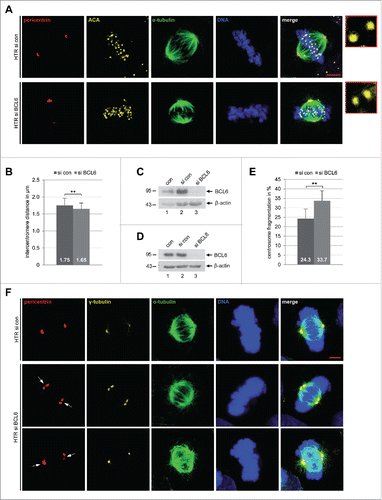
Figure 5. Proliferation pattern of trophoblasts under hypoxia and depletion of BCL6 reduces proliferation. (A) HTR cells were cultured in an incubator supplied either with 21% O2 (normoxia) or with 3% O2 (hypoxia) for indicated time periods for the evaluation of cell viability. The results are presented as mean ± SD and statistically analyzed. ***p < 0.001, **p < 0.01, *p < 0.05. (B) HTR cells were treated as in (A) and harvested for Western blot analysis with indicated antibodies. β-actin served as loading control. (C) JAR cells were treated as in (A) for viability evaluation. The results are presented as mean ± SD and statistically analyzed. *p < 0.05. (D) Treated JAR cells were harvested for Western blot analysis with indicated antibodies. β-actin served as loading control. (E) BeWo cells were treated as in (A) for viability evaluation. The results are presented as mean ± SD and statistically analyzed. *p < 0.05, ***p < 0.001. (F) Treated BeWo cells were harvested for Western blot analysis with indicated antibodies. β-actin served as loading control. (G) HTR cells were non-treated, treated with control siRNA or siRNA against BCL6 and cultured for indicated time periods under hypoxia. The viability was measured and the results are presented as mean ± SD and statistically analyzed. *p < 0.05. (H) Cellular lysates were prepared from HTR cells for Western blot analysis with indicated antibodies. β-actin served as loading control. (I) JAR cells were non-treated, treated with control siRNA or siRNA against BCL6 and cultured for indicated time periods under hypoxia. The viability was measured and the results are presented as mean ± SD and statistically analyzed. **p < 0.01. (J) Cellular lysates were prepared from JAR cells for Western blot analyses with indicated antibodies. β-actin served as loading control. (K) BeWo cells were non-treated, treated with control siRNA or siRNA against BCL6 and further cultured for indicated time periods under hypoxia. The viability was measured and the results are presented as mean ± SD. (L) Cellular lysates were prepared from BeWo cells for Western blot analysis with indicated antibodies. β-actin served as loading control.
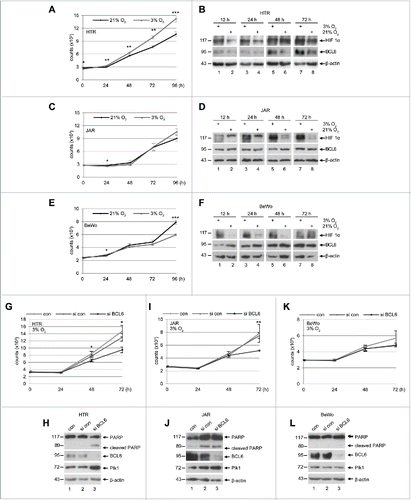
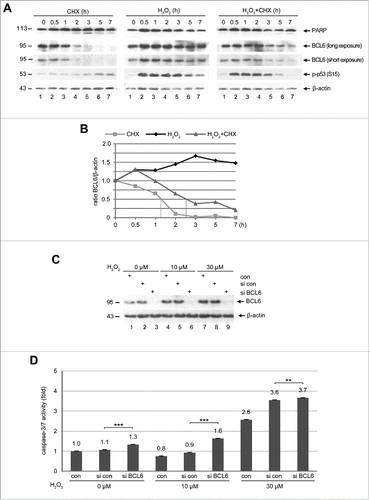
Figure 6. BCL6 is stabilized and its suppression induces apoptosis under stress situation. (A) Western blot analysis. HTR cells were subjected to 25 µM CHX (left panel), 50 µM H2O2 (middle panel) or both (right panel), for indicated time periods and harvested for Western blot analysis with indicated antibodies. β-actin served as loading control. (B) Quantification of BCL6 in (A), relative to corresponding β-actin. The dot lines indicate the half-life time of corresponding BCL6. (C) HTR cells were non-transfected as control (con), transfected with control siRNA (si con) or siRNA against BCL6 (si BCL6) for 24 h and subjected to increasing concentrations of H2O2 for further 12 h. Cells were then harvested for Western blot analysis with BCL6 antibody. β-actin served as loading control. (D) Relative activity of caspase-3/7. The value of non-transfected and non-treated cells was defined as 1-fold. ***p < 0.001, **p < 0.01.