1,875
Views
21
CrossRef citations to date
0
Altmetric
Reports

Inhibition of the mitochondrial unfolded protein response by acetylcholine alleviated hypoxia/reoxygenation-induced apoptosis of endothelial cells

, , , , &
Pages 1331-1343 | Received 05 Feb 2016, Accepted 26 Feb 2016, Published online: 25 Apr 2016

Figures & data

Figure 1. UPRmt and mtROS generation are involved in H/R-induced endothelial injury. (A) mtROS production in HUVECs was detected using different time courses of reoxygenation. In the mitochondrial ROS assay, MitoSOX Red fluorescence colocalized with that of MitoTracker Green. Scale bar, 50 μm. (B) HUVEC lysates after different time courses of reoxygenation were immunoblotted using antibodies against HSP60 and LONP1. GAPDH served as the internal control. Quantitative analysis of HSP60 and LONP1 expression during different post-reoxygenation time courses. Open bar, normoxia; filled bar, H/R. The data expressed as mean ± SEM in each bar graph represent the average of 4 independent experiments. *P < 0.05 vs. Con; **P < 0.01 vs. Con; ***P < 0.001 vs. Con; ###P < 0.001 vs. H/R.
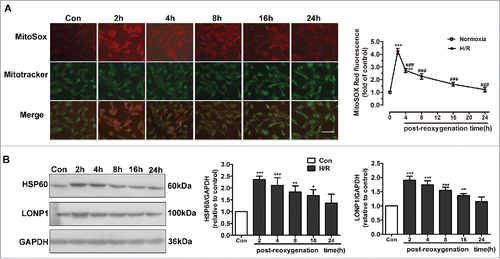
Figure 1. UPRmt and mtROS generation are involved in H/R-induced endothelial injury. (A) mtROS production in HUVECs was detected using different time courses of reoxygenation. In the mitochondrial ROS assay, MitoSOX Red fluorescence colocalized with that of MitoTracker Green. Scale bar, 50 μm. (B) HUVEC lysates after different time courses of reoxygenation were immunoblotted using antibodies against HSP60 and LONP1. GAPDH served as the internal control. Quantitative analysis of HSP60 and LONP1 expression during different post-reoxygenation time courses. Open bar, normoxia; filled bar, H/R. The data expressed as mean ± SEM in each bar graph represent the average of 4 independent experiments. *P < 0.05 vs. Con; **P < 0.01 vs. Con; ***P < 0.001 vs. Con; ###P < 0.001 vs. H/R.

Figure 2. NAC treatment inhibited the UPRmt and protected mitochondrial structure and function against H/R injury. (A) NAC administration reduced mitochondrial ROS levels in the context of H/R. (B) NAC treatment inhibited the upregulation of HSP60, LONP1, CLPP1 and CHOP expression induced by H/R. (C) Transmission electron microscopy indicated that NAC prevented the ultrastructural changes triggered by H/R in HUVECs, particularly the changes in mitochondrial area, perimeter, Feret's diameter and volume density. Magnification, 40000×; scale bar, 500 nm. The number of mitochondria is shown in the circle. (D) Intracellular ATP levels after NAC pretreatment were determined using ATPlite. (E) The H/R-induced increase in TUNEL-positive cells was inhibited by NAC treatment. Scale bar, 50 μm. Open bar, normoxia; filled bar, H/R. The data expressed as mean ± SEM in each bar graph represent the average of 4 independent experiments. *P < 0.05 vs. Con; **P < 0.01 vs. Con; ***P < 0.001 vs. Con; #P < 0.05 vs. H/R; ##P < 0.01 vs. H/R; ###P < 0.001 vs. H/R.
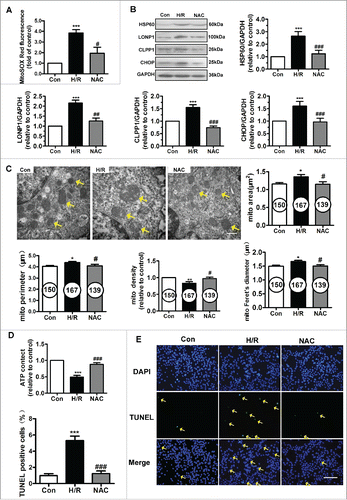
Figure 2. NAC treatment inhibited the UPRmt and protected mitochondrial structure and function against H/R injury. (A) NAC administration reduced mitochondrial ROS levels in the context of H/R. (B) NAC treatment inhibited the upregulation of HSP60, LONP1, CLPP1 and CHOP expression induced by H/R. (C) Transmission electron microscopy indicated that NAC prevented the ultrastructural changes triggered by H/R in HUVECs, particularly the changes in mitochondrial area, perimeter, Feret's diameter and volume density. Magnification, 40000×; scale bar, 500 nm. The number of mitochondria is shown in the circle. (D) Intracellular ATP levels after NAC pretreatment were determined using ATPlite. (E) The H/R-induced increase in TUNEL-positive cells was inhibited by NAC treatment. Scale bar, 50 μm. Open bar, normoxia; filled bar, H/R. The data expressed as mean ± SEM in each bar graph represent the average of 4 independent experiments. *P < 0.05 vs. Con; **P < 0.01 vs. Con; ***P < 0.001 vs. Con; #P < 0.05 vs. H/R; ##P < 0.01 vs. H/R; ###P < 0.001 vs. H/R.

Figure 3. ACh administration decreased H/R-induced mtROS levels and UPRmt via M3AChR. (A) ACh diminished H/R-induced mtROS levels in a dose-dependent manner. In the mitochondrial ROS assay, MitoSOX Red fluorescence was colocalized with that of MitoTracker Green. Scale bar, 50 μm. (B and C) ACh inhibited the expression of HSP60 and LONP1 in a dose-dependent manner. Open bar, normoxia; filled bar, H/R. (D) ACh increased the reduction in the nuclear DNA-encoded ATP5A/mitochondrial DNA-encoded MTCO1 ratio. (E) ACh treatment decreased the upregulation of HSP60 and LONP1 expression induced by H/R. The beneficial effect of ACh was abolished by the M3AChR antagonist 4-DAMP (10−6M). Open bar, normoxia; filled bar, H/R. The data expressed as mean ± SEM in each bar graph represent the average of 4 independent experiments. ***P < 0.001 vs. Con; ##P < 0.01 vs. H/R. ###P < 0.001 vs. H/R; &&P < 0.01 vs. H/R + ACh; &&&P < 0.001 vs. H/R + ACh.
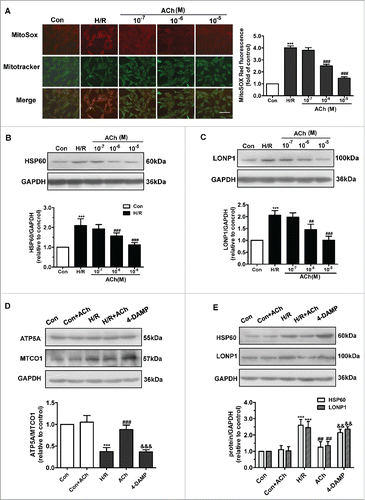
Figure 3. ACh administration decreased H/R-induced mtROS levels and UPRmt via M3AChR. (A) ACh diminished H/R-induced mtROS levels in a dose-dependent manner. In the mitochondrial ROS assay, MitoSOX Red fluorescence was colocalized with that of MitoTracker Green. Scale bar, 50 μm. (B and C) ACh inhibited the expression of HSP60 and LONP1 in a dose-dependent manner. Open bar, normoxia; filled bar, H/R. (D) ACh increased the reduction in the nuclear DNA-encoded ATP5A/mitochondrial DNA-encoded MTCO1 ratio. (E) ACh treatment decreased the upregulation of HSP60 and LONP1 expression induced by H/R. The beneficial effect of ACh was abolished by the M3AChR antagonist 4-DAMP (10−6M). Open bar, normoxia; filled bar, H/R. The data expressed as mean ± SEM in each bar graph represent the average of 4 independent experiments. ***P < 0.001 vs. Con; ##P < 0.01 vs. H/R. ###P < 0.001 vs. H/R; &&P < 0.01 vs. H/R + ACh; &&&P < 0.001 vs. H/R + ACh.

Figure 4. ACh treatment suppressed the mitochondrial pathway of apoptosis. (A) ACh upregulated the Bcl-2/Bax ratio and suppressed cytochrome C and Omi/HtrA2 release, and these effects of ACh were abrogated by treatment with 4-DAMP. Quantification is shown in the bar graph. (B) ACh decreased the release of Smac/DIABLO from mitochondria into the cytosol. Scale bar, 10 μm. Open bar, normoxia; filled bar, H/R. The data expressed as mean ± SEM in each bar graph represent the average of 4 independent experiments. ***P < 0.001 vs. Con; ###P < 0.001 vs. H/R; &&P < 0.01 vs. H/R + ACh; &&&P < 0.001 vs. H/R + ACh.
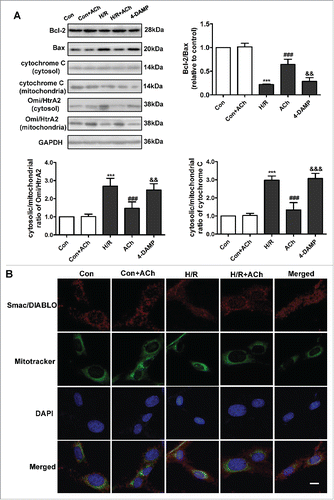
Figure 4. ACh treatment suppressed the mitochondrial pathway of apoptosis. (A) ACh upregulated the Bcl-2/Bax ratio and suppressed cytochrome C and Omi/HtrA2 release, and these effects of ACh were abrogated by treatment with 4-DAMP. Quantification is shown in the bar graph. (B) ACh decreased the release of Smac/DIABLO from mitochondria into the cytosol. Scale bar, 10 μm. Open bar, normoxia; filled bar, H/R. The data expressed as mean ± SEM in each bar graph represent the average of 4 independent experiments. ***P < 0.001 vs. Con; ###P < 0.001 vs. H/R; &&P < 0.01 vs. H/R + ACh; &&&P < 0.001 vs. H/R + ACh.

Figure 5. ACh treatment preserved mitochondrial morphology and function via M3AChR. (A) Ultrastructural changes in mitochondria in HUVECs. Magnification, 40000×; scale bar, 500 nm. Mitochondrial area, volume density, Feret's diameter and perimeter are shown in (B). (C) ACh treatment prevented the H/R-induced decrease in ATP production. Open bar, normoxia; filled bar, H/R. The data expressed as mean ± SEM in each bar graph represent the average of 4 independent experiments. *P < 0.05 vs. Con; **P < 0.01 vs. Con; ***P < 0.001 vs. Con; #P < 0.05 vs. H/R. ##P < 0.01 vs. H/R; &P < 0.05 vs. H/R + ACh; &&P < 0.01 vs. H/R + ACh.
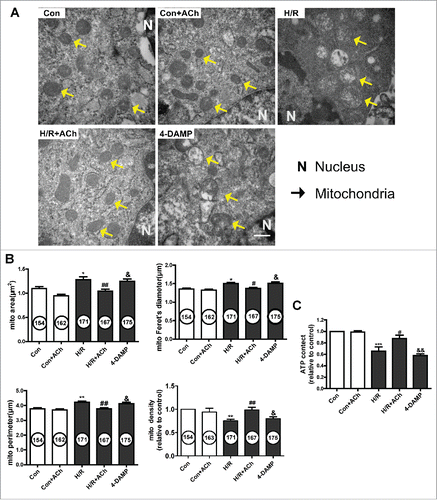
Figure 5. ACh treatment preserved mitochondrial morphology and function via M3AChR. (A) Ultrastructural changes in mitochondria in HUVECs. Magnification, 40000×; scale bar, 500 nm. Mitochondrial area, volume density, Feret's diameter and perimeter are shown in (B). (C) ACh treatment prevented the H/R-induced decrease in ATP production. Open bar, normoxia; filled bar, H/R. The data expressed as mean ± SEM in each bar graph represent the average of 4 independent experiments. *P < 0.05 vs. Con; **P < 0.01 vs. Con; ***P < 0.001 vs. Con; #P < 0.05 vs. H/R. ##P < 0.01 vs. H/R; &P < 0.05 vs. H/R + ACh; &&P < 0.01 vs. H/R + ACh.

Figure 6. Knockdown of M3AChR blocked the beneficial effects of ACh during H/R. (A) Silencing efficiency of M3AChR siRNA. Cells were transfected with siRNA followed by H/R. (B) ACh administration restored the mitonuclear protein balance, and M3AChR siRNA abolished the protective effects. Changes in HSP60 and LONP1 expression (C) were determined after application of M3AChR/NC siRNA with or without ACh. The data expressed as mean ± SEM in each bar graph represent the average of 4 independent experiments. **P < 0.01 vs. NC siRNA group; ***P < 0.001 vs. NC siRNA group; ##P < 0.01 vs. ACh-treated NC siRNA group; ###P < 0.001 vs. ACh-treated NC siRNA group.
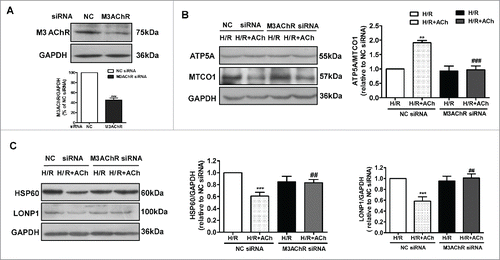
Figure 6. Knockdown of M3AChR blocked the beneficial effects of ACh during H/R. (A) Silencing efficiency of M3AChR siRNA. Cells were transfected with siRNA followed by H/R. (B) ACh administration restored the mitonuclear protein balance, and M3AChR siRNA abolished the protective effects. Changes in HSP60 and LONP1 expression (C) were determined after application of M3AChR/NC siRNA with or without ACh. The data expressed as mean ± SEM in each bar graph represent the average of 4 independent experiments. **P < 0.01 vs. NC siRNA group; ***P < 0.001 vs. NC siRNA group; ##P < 0.01 vs. ACh-treated NC siRNA group; ###P < 0.001 vs. ACh-treated NC siRNA group.
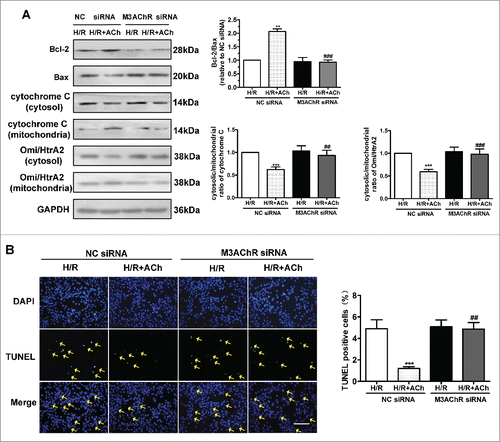
Figure 7. Knockdown of M3AChR abrogated the anti-apoptotic effect of ACh. (A) Representative immunoblots and quantitative analysis of the Bcl-2/Bax ratio, cytochrome C and the Omi/HtrA2 ratio after application of M3AChR/NC siRNA with or without ACh. (B) TUNEL-positive cells were enumerated after application of M3AChR/NC siRNA with or without ACh. Scale bar, 50 μm. The data expressed as mean ± SEM in each bar graph represent the average of 4 independent experiments. **P < 0.01 vs. NC siRNA group; ***P < 0.001 vs. NC siRNA group; ##P < 0.01 vs. ACh-treated NC siRNA group; ###P < 0.001 vs. ACh-treated NC siRNA group.

Figure 7. Knockdown of M3AChR abrogated the anti-apoptotic effect of ACh. (A) Representative immunoblots and quantitative analysis of the Bcl-2/Bax ratio, cytochrome C and the Omi/HtrA2 ratio after application of M3AChR/NC siRNA with or without ACh. (B) TUNEL-positive cells were enumerated after application of M3AChR/NC siRNA with or without ACh. Scale bar, 50 μm. The data expressed as mean ± SEM in each bar graph represent the average of 4 independent experiments. **P < 0.01 vs. NC siRNA group; ***P < 0.001 vs. NC siRNA group; ##P < 0.01 vs. ACh-treated NC siRNA group; ###P < 0.001 vs. ACh-treated NC siRNA group.

Figure 8. Proposed schematic of the mechanism by which ACh protects the endothelium against H/R injury. ACh decreases expression of the UPRmt by inhibiting mtROS formation and suppressing the mitonuclear protein imbalance during H/R, presumably through M3AChR. Consequently, ACh reduces the release of pro-apoptotic proteins (Smac/DIABLO, Omi/HtrA2, cytochrome C) and preserves endothelial mitochondrial ultrastructure and function, thus reducing the number of TUNEL-positive cells.
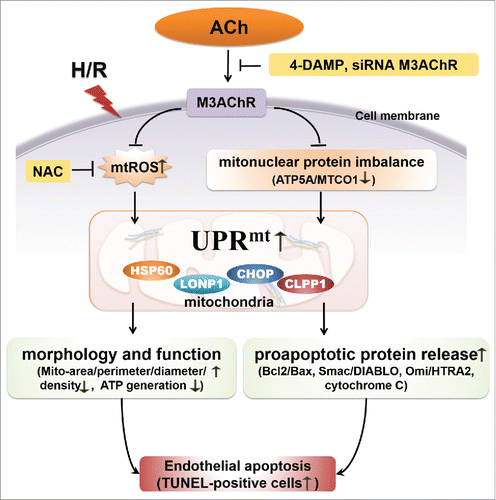
Figure 8. Proposed schematic of the mechanism by which ACh protects the endothelium against H/R injury. ACh decreases expression of the UPRmt by inhibiting mtROS formation and suppressing the mitonuclear protein imbalance during H/R, presumably through M3AChR. Consequently, ACh reduces the release of pro-apoptotic proteins (Smac/DIABLO, Omi/HtrA2, cytochrome C) and preserves endothelial mitochondrial ultrastructure and function, thus reducing the number of TUNEL-positive cells.

Reprints and Corporate Permissions

Please note: Selecting permissions does not provide access to the full text of the article, please see our help page How do I view content?

To request a reprint or corporate permissions for this article, please click on the relevant link below:

Academic Permissions

Please note: Selecting permissions does not provide access to the full text of the article, please see our help page How do I view content?

Obtain permissions instantly via Rightslink by clicking on the button below:

If you are unable to obtain permissions via Rightslink, please complete and submit this Permissions form. For more information, please visit our Permissions help page.