Figures & data
Figure 1. Hormetic response to mild stress in human cell lines. Human SW620 and SW620:8055R cell lines, the parental sensitive and a derived resistance line, were exposed to increasing concentrations of TOR kinase inhibitor, AZD8055, for 24 hours. Proliferation was assayed by [3H]thymidine incorporation. This figure is based on Figure 2 A of Cope et al.Citation26. We added a gray box to highlight the area of increased fitness.
![Figure 1. Hormetic response to mild stress in human cell lines. Human SW620 and SW620:8055R cell lines, the parental sensitive and a derived resistance line, were exposed to increasing concentrations of TOR kinase inhibitor, AZD8055, for 24 hours. Proliferation was assayed by [3H]thymidine incorporation. This figure is based on Figure 2 A of Cope et al.Citation26. We added a gray box to highlight the area of increased fitness.](/cms/asset/eeef0634-b1a7-4f86-94c2-34bed83a8b60/kccy_a_1218104_f0001_b.gif)
Figure 2. Passaging procedure. Freshly unfrozen strains were patched on YEPD agar plates and incubated at 23°C for 3 days, then passaged at 23°C or 25°C on YEPD agar plates as shown. 5–10 colonies from each genotype were pooled at each passage. Strains were: DDY81, 739, 738, 737, 736, 735, DLY1108, 1195, 3001. A) Genotypes of strains streaked on agar plates. B) Cells passaged for 2 passages at 25°C. C) Cells passaged for 2 passages at 23°C. DDY strains are diploids. DLY strains are haploids.
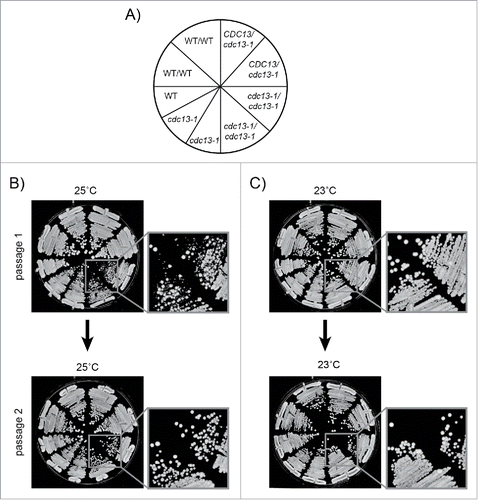
Figure 3. The effects of adaptation to low-level of telomere stress in cdc13-1 mutants. Diploid strains with the genotypes indicated were grown on solid agar plates for 10 passages at 23°C, 10 passages at 25°C, or for 7 passages at 25°C followed by 3 passages at 23°C as indicated on the left of the Figure. Strains (DDY735, 736, 737, 738, 739 and DLY1108) were then inoculated into liquid and grown overnight at 23°C or 25°C. Fivefold dilution series of strains were set up in 96 well plates transferred to several independent solid YEPD agar plates using a pin tool. Individual plates were incubated at different temperatures, indicated across the top of the Figure, and photographs taken after 24, 48 and 72 hours of incubation. Arrows on right indicate haploid cultures.
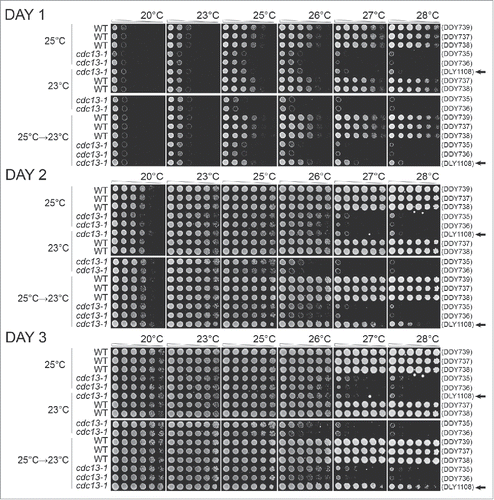
Figure 4. Adaptation to telomere stress in the absence of key stress response proteins. Diploid strains of different genotypes were analyzed as in except that strains were passaged twice at high temperature (25°C or 26°C), or once at high temperature followed by a single passage at low temperature, before being spotted onto agar plates. A) Strains as in . Strains were DDY735, 736, 737, 738 and 739. B) Strains were DDY739; 868, 869, 860 and 861. C) Strains were DDY739, 992, 993, 994 and 995. D) Strains were DDY739, 974, 975, 972, 973. All strains shown in each subsection, at each temperature, were grown on single agar plates but images have been cut and pasted to make comparisons easier. Images were taken at 48 hours of incubation. Images taken after 24, 48 and 72 hours incubation are shown in Supplementary Figures: 2, 3 and 4, respectively.
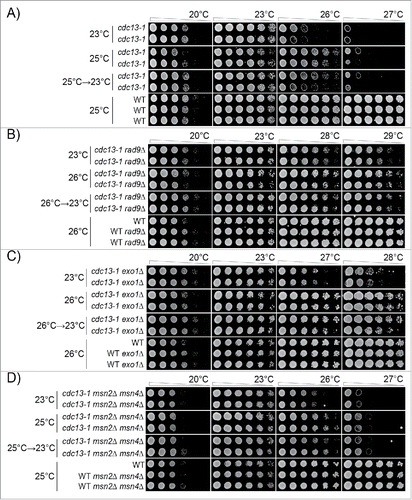
Figure 5. Adaptation to low-level kinase inhibition in cdc15-2 mutants. Diploid strains of different genotypes were analyzed as in . Strains were grown for 3 passages at 23°C or 30°C on agar plates, or for 1 passage at 30°C and 2 at 23°C. A) Strains were DDY739; 839, 840, 841, 842. B) Strains were DDY739; 1036, 1037 1038, 1039. All strains shown in each subsection, at each temperature, were grown on single agar plates. Images taken after 24, 48 and 72 hours incubation are shown in Supplementary Figures: 5 and 6, respectively.
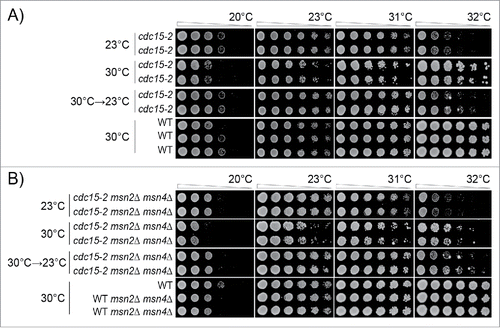
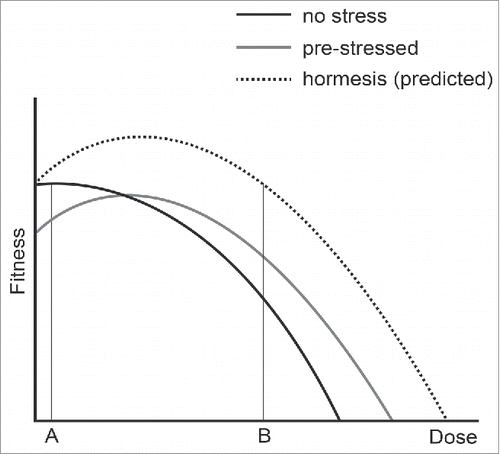
Figure 6. The effects of adaptation to mild stress. Three curves are used to represent the fitness of yeast cells that were previously not stressed (black line), pre-stressed (gray line) or show a hormetic response (dashed line). A and B indicate low and high doses of stress.
