1,198
Views
10
CrossRef citations to date
0
Altmetric
Report

Cyclin-dependent kinase inhibitor flavopiridol promotes remyelination in a cuprizone induced demyelination model

, , , , , , & show all
Pages 2780-2791 | Received 11 May 2016, Accepted 31 Jul 2016, Published online: 31 Aug 2016

Figures & data

Table 1. PCR array results following CPZ administration.

Figure 1. Timeline of experimental procedures. (A) C57BL/6 mice were given 0.2% cuprizone-containing or normal diet for 5 weeks. On the last day, 3 mice from each group were sacrificed and their brains were used for microarray analysis. The remaining 5 of each group were intraperitoneally injected with a BrdU solution (50mg/kg) every 2 hours for 6 times on the same day. Twelve hours after the last injection, mice were sacrificed and their brain tissue were used for immunochemical staining. (B) C57BL/6 mice were given 0.2% cuprizone-containing or normal diet for 5 weeks. During the 5th week, FLA (5 mg/kg, ip) or vehicle (2.28% DMSO in saline) was administrated once daily. Mice were subjected to Y maze test in the subsequent 2 d. Twenty-four 24 hours after behavioral test, mice were sacrificed and their brain tissue was used for immunohistochemical staining.
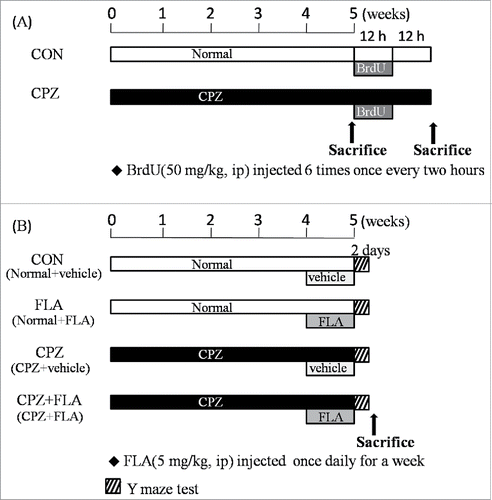
Figure 1. Timeline of experimental procedures. (A) C57BL/6 mice were given 0.2% cuprizone-containing or normal diet for 5 weeks. On the last day, 3 mice from each group were sacrificed and their brains were used for microarray analysis. The remaining 5 of each group were intraperitoneally injected with a BrdU solution (50mg/kg) every 2 hours for 6 times on the same day. Twelve hours after the last injection, mice were sacrificed and their brain tissue were used for immunochemical staining. (B) C57BL/6 mice were given 0.2% cuprizone-containing or normal diet for 5 weeks. During the 5th week, FLA (5 mg/kg, ip) or vehicle (2.28% DMSO in saline) was administrated once daily. Mice were subjected to Y maze test in the subsequent 2 d. Twenty-four 24 hours after behavioral test, mice were sacrificed and their brain tissue was used for immunohistochemical staining.

Figure 2. Effects of CPZ administration on cell cycle exit index. (A) Representative micrographs showing brain cells labeled by anti-BrdU and anti-Ki-67. Arrowheads point to BrdU+/Ki67 cells (cells that were BrdU positive but immunonegative for Ki-67). CC, corpus callosum; Str, striatum; lv, lateral ventricle. (B) Quantitative data showing proportions of cycling cells (quotient of BrdU+/Ki67+ cells over the total number of BrdU+ cells) in the anterior SVZ of mice. (C) Histogram representing the cell cycle exit index, which was calculated by dividing the number of BrdU+/Ki67 cells by the total number of BrdU+ cells.

Figure 2. Effects of CPZ administration on cell cycle exit index. (A) Representative micrographs showing brain cells labeled by anti-BrdU and anti-Ki-67. Arrowheads point to BrdU+/Ki67− cells (cells that were BrdU positive but immunonegative for Ki-67). CC, corpus callosum; Str, striatum; lv, lateral ventricle. (B) Quantitative data showing proportions of cycling cells (quotient of BrdU+/Ki67+ cells over the total number of BrdU+ cells) in the anterior SVZ of mice. (C) Histogram representing the cell cycle exit index, which was calculated by dividing the number of BrdU+/Ki67− cells by the total number of BrdU+ cells.
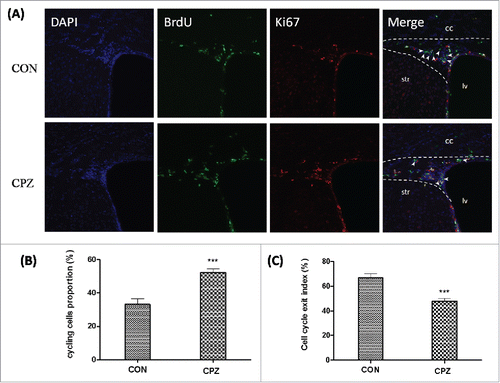
Figure 3. FLA alleviated the CPZ-induced increase in NG2 positive cells in PFC. Representative micrographs showed NG2 positive cells in the PFC of mouse from each group. CPZ-exposed mouse seemed to have the densest NG2 positive cells in the PFC among all groups. The bar equals 50 μm. The statistical analysis of quantitative data indicated that CPZ-exposure increased number of NG2 positive cells in the PFC as compared to other groups. No difference was found between any other 2 groups. Data (obtained from 4 animals in each group) were expressed as the mean ± SEM. ***p < 0.001 compared with the control group, ###p < 0.001 compared with the CPZ group.
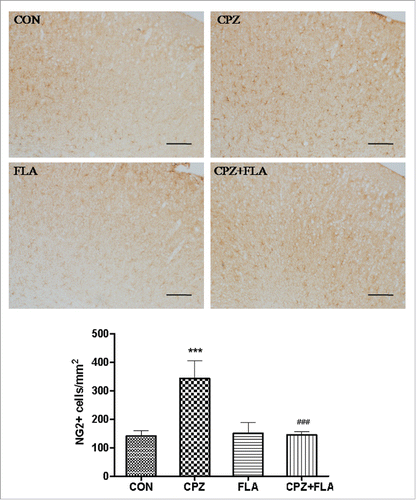
Figure 3. FLA alleviated the CPZ-induced increase in NG2 positive cells in PFC. Representative micrographs showed NG2 positive cells in the PFC of mouse from each group. CPZ-exposed mouse seemed to have the densest NG2 positive cells in the PFC among all groups. The bar equals 50 μm. The statistical analysis of quantitative data indicated that CPZ-exposure increased number of NG2 positive cells in the PFC as compared to other groups. No difference was found between any other 2 groups. Data (obtained from 4 animals in each group) were expressed as the mean ± SEM. ***p < 0.001 compared with the control group, ###p < 0.001 compared with the CPZ group.

Figure 4. FLA alleviated the CPZ-induced demyelination in PFC. Representative micrographs showed MBP-immunostaining in the PFC of mouse from each group. CPZ-exposed mouse showed evident myelin breakdown in the PFC, but it was not so obvious in the mouse co-administer CPZ and FLA. The bar equals 50 μm. The optical density analysis confirmed the lowest optical density of MBP-immunostaining in the CPZ group. Differences between CPZ+FLA and CON or FLA were also significant. Data (obtained from 4 animals in each group) were expressed as the means ± SEM. ***p < 0.001 compared with the control group, ###p < 0.001 compared with the CPZ group.
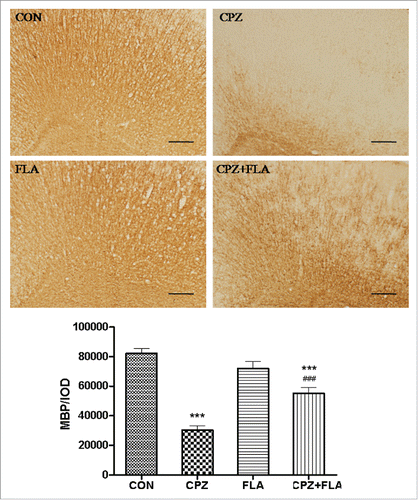
Figure 4. FLA alleviated the CPZ-induced demyelination in PFC. Representative micrographs showed MBP-immunostaining in the PFC of mouse from each group. CPZ-exposed mouse showed evident myelin breakdown in the PFC, but it was not so obvious in the mouse co-administer CPZ and FLA. The bar equals 50 μm. The optical density analysis confirmed the lowest optical density of MBP-immunostaining in the CPZ group. Differences between CPZ+FLA and CON or FLA were also significant. Data (obtained from 4 animals in each group) were expressed as the means ± SEM. ***p < 0.001 compared with the control group, ###p < 0.001 compared with the CPZ group.
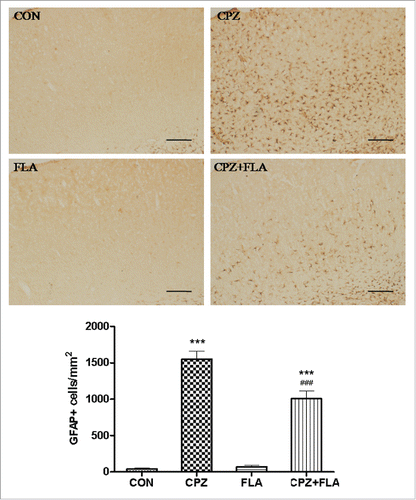
Figure 5. FLA alleviated the CPZ-induced increase in GFAP positive cells in PFC. Representative micrographs showed GFAP positive cells in the PFC of mouse from each group. CPZ-exposed mouse showed the densest GFAP positive cells in the PFC, but it was not so in the mouse co-administer CPZ and FLA. The bar equals 50 μm. The statistical analysis of the quantitative data confirmed the densest GFAP positive cells in the CPZ group. Differences between CPZ+FLA and anyone of the other groups were also significant. Data (obtained from 4 animals in each group) were expressed as the means ± SEM. ***p < 0.001 compared with the control group, ###p < 0.001 compared with the CPZ group.

Figure 5. FLA alleviated the CPZ-induced increase in GFAP positive cells in PFC. Representative micrographs showed GFAP positive cells in the PFC of mouse from each group. CPZ-exposed mouse showed the densest GFAP positive cells in the PFC, but it was not so in the mouse co-administer CPZ and FLA. The bar equals 50 μm. The statistical analysis of the quantitative data confirmed the densest GFAP positive cells in the CPZ group. Differences between CPZ+FLA and anyone of the other groups were also significant. Data (obtained from 4 animals in each group) were expressed as the means ± SEM. ***p < 0.001 compared with the control group, ###p < 0.001 compared with the CPZ group.

Figure 6. FLA alleviated the CPZ-induced increase inIba-1positive cells in PFC. Representative micrographs showed Iba-1 positive cells in the PFCof mouse from each group. CPZ-exposed mouse showed the densest Iba-1positive cells in the PFC, but it was not so in the mouse co-administer CPZ and FLA. The bar equals 50 μm. The statistical analysis of the quantitative data confirmed the densest Iba-1 positive cells in the CPZ group. Differences between CPZ+FLA and anyone of the other groups were also significant. Data (obtained from 4 animals in each group) were expressed as the mean ± SEM. ***p < 0.001 compared with the control group, ##p < 0.01 compared with the CPZ group.
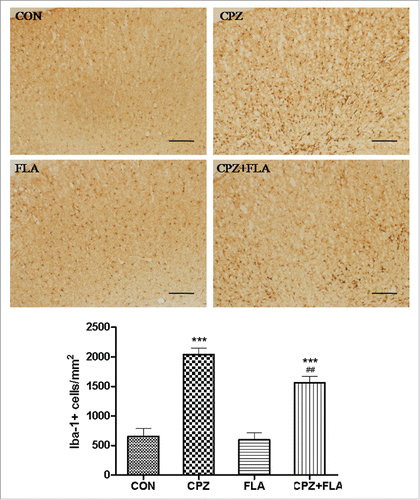
Figure 6. FLA alleviated the CPZ-induced increase inIba-1positive cells in PFC. Representative micrographs showed Iba-1 positive cells in the PFCof mouse from each group. CPZ-exposed mouse showed the densest Iba-1positive cells in the PFC, but it was not so in the mouse co-administer CPZ and FLA. The bar equals 50 μm. The statistical analysis of the quantitative data confirmed the densest Iba-1 positive cells in the CPZ group. Differences between CPZ+FLA and anyone of the other groups were also significant. Data (obtained from 4 animals in each group) were expressed as the mean ± SEM. ***p < 0.001 compared with the control group, ##p < 0.01 compared with the CPZ group.

Figure 7. FLA alleviated the CPZ-induced spatial working memory impairment in mice. CPZ-exposed mice showed a lowest percentage of spontaneous alternation among all groups. Differences between CPZ + FLA and anyone of the other groups were also significant. Data (obtained from10 animals in each group) were expressed as mean ± SEM. ***p < 0.001 compared with the control group, ###p < 0.001 compared with the CPZ group.
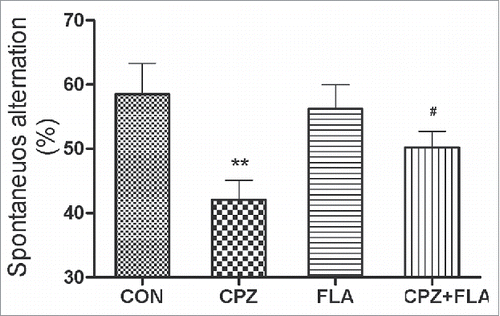
Figure 7. FLA alleviated the CPZ-induced spatial working memory impairment in mice. CPZ-exposed mice showed a lowest percentage of spontaneous alternation among all groups. Differences between CPZ + FLA and anyone of the other groups were also significant. Data (obtained from10 animals in each group) were expressed as mean ± SEM. ***p < 0.001 compared with the control group, ###p < 0.001 compared with the CPZ group.
Supplemental material

KCCY_A_1220458_Supplement.zip

Download Zip (12.7 MB)

Reprints and Corporate Permissions

Please note: Selecting permissions does not provide access to the full text of the article, please see our help page How do I view content?

To request a reprint or corporate permissions for this article, please click on the relevant link below:

Academic Permissions

Please note: Selecting permissions does not provide access to the full text of the article, please see our help page How do I view content?

Obtain permissions instantly via Rightslink by clicking on the button below:

If you are unable to obtain permissions via Rightslink, please complete and submit this Permissions form. For more information, please visit our Permissions help page.