3,431
Views
46
CrossRef citations to date
0
Altmetric
Extra View

SAMHD1 protects cancer cells from various nucleoside-based antimetabolites

ORCID Icon, ORCID Icon, , , ORCID Icon, ORCID Icon, , & ORCID Icon show all
Pages 1029-1038 | Received 10 Feb 2017, Accepted 27 Mar 2017, Published online: 08 May 2017

Figures & data

Figure 1. Intracellular conversion of cytarabine (ara-C) to ara-CTP and detoxification by SAMHD1. The schematic depicts canonical pathways for the intracellular synthesis of ara-CTP, the active metabolite of ara-C, which exerts DNA-damage and antiproliferative downstream effects by interfering with DNA synthesis. SAMHD1 is activated by binding of GTP or dGTP to allosteric site 1 (AS1), binding of a dNTP to allosteric site 2 (AS2) and binding of its substrate in the catalytic site. Ara-CTP is a substrate for SAMHD1 but not an allosteric activator. Abbreviations: CDA, cytidine deaminase; DCK, deoxyctidine kinase; NT5C2, cytosolic nucleotidase-II; DCTD, deoxycytidylate deaminase.
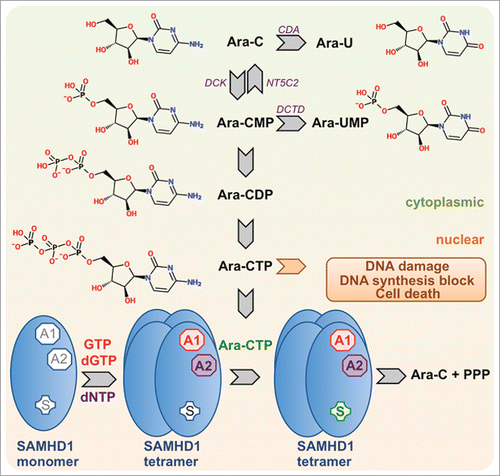
Figure 1. Intracellular conversion of cytarabine (ara-C) to ara-CTP and detoxification by SAMHD1. The schematic depicts canonical pathways for the intracellular synthesis of ara-CTP, the active metabolite of ara-C, which exerts DNA-damage and antiproliferative downstream effects by interfering with DNA synthesis. SAMHD1 is activated by binding of GTP or dGTP to allosteric site 1 (AS1), binding of a dNTP to allosteric site 2 (AS2) and binding of its substrate in the catalytic site. Ara-CTP is a substrate for SAMHD1 but not an allosteric activator. Abbreviations: CDA, cytidine deaminase; DCK, deoxyctidine kinase; NT5C2, cytosolic nucleotidase-II; DCTD, deoxycytidylate deaminase.

Figure 2. Overexpression of wild type but not catalytic-inactive SAMHD1 confers resistance to ara-C treatment in vivo. HL-60/iva CRISPR/Cas9 cells lacking endogenous SAMHD1 expression were transduced with a lentiviral vector encoding for HA-tagged wild type (black) or the catalytically-inactive H233A mutant (red) SAMHD1. Equal expression levels of ectopic SAMHD1 were confirmed by western blotting (a). Cells were xenotransplanted into NOD/SCID IL2R−/− female mice; (n = 12 for each cell line), which were subsequently treated with either PBS or ara-C. Clinical signs of disease (b) and percentage of survival (c) were determined over time. For details see Methods.
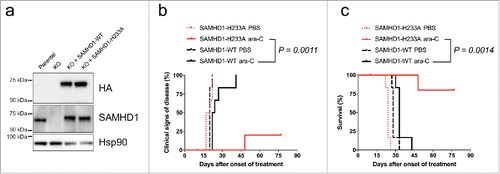
Figure 2. Overexpression of wild type but not catalytic-inactive SAMHD1 confers resistance to ara-C treatment in vivo. HL-60/iva CRISPR/Cas9 cells lacking endogenous SAMHD1 expression were transduced with a lentiviral vector encoding for HA-tagged wild type (black) or the catalytically-inactive H233A mutant (red) SAMHD1. Equal expression levels of ectopic SAMHD1 were confirmed by western blotting (a). Cells were xenotransplanted into NOD/SCID IL2R−/− female mice; (n = 12 for each cell line), which were subsequently treated with either PBS or ara-C. Clinical signs of disease (b) and percentage of survival (c) were determined over time. For details see Methods.

Figure 3. Diverse anti-neoplastic nucleoside analogs are more toxic in the absence of SAMHD1. THP-1 CRISPR/Cas9 control cells (black) or cells lacking a functional SAMHD1 gene (red) were treated in parallel with the indicated concentrations of cytarabine (a), vidarabine (b), nelarabine (c), fludarabine (d), clofarabine (e), decitabine (f) or trifluridine (g). Cells were treated for 3 days, or 6 d in the case of decitabine to obtain maximal cytotoxicity as described previously,Citation87 and cell viability was determined using a colorimetric proliferation inhibition assay. Representative experiments from a total of at least 2 independent experiments performed in triplicate are shown. EC50 values (for ctrl SAMHD1+/+ vs. g2–2 SAMHD1−/−) were calculated using a non-linear regression curve fit (for details see Methods): a: 53.6 µM vs. 0.4 µM, b: 657.6 µM vs. 87.8 µM; c: 2114 µM vs. 65.2 µM, d: 8.3 µM vs. 1.5 µM; e: 135.8 nM vs. 57.7 nM; f: 521 µM vs. 0.5 µM; g: 20.7 µM vs. 3.0 µM. Curves were compared by means of Extra-sum-of-squares F tests (**: P ≤ 0.01; ****: P ≤ 0.0001).
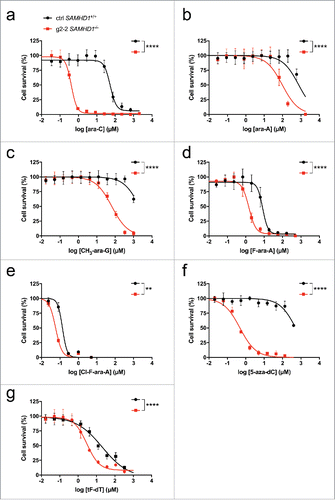
Figure 3. Diverse anti-neoplastic nucleoside analogs are more toxic in the absence of SAMHD1. THP-1 CRISPR/Cas9 control cells (black) or cells lacking a functional SAMHD1 gene (red) were treated in parallel with the indicated concentrations of cytarabine (a), vidarabine (b), nelarabine (c), fludarabine (d), clofarabine (e), decitabine (f) or trifluridine (g). Cells were treated for 3 days, or 6 d in the case of decitabine to obtain maximal cytotoxicity as described previously,Citation87 and cell viability was determined using a colorimetric proliferation inhibition assay. Representative experiments from a total of at least 2 independent experiments performed in triplicate are shown. EC50 values (for ctrl SAMHD1+/+ vs. g2–2 SAMHD1−/−) were calculated using a non-linear regression curve fit (for details see Methods): a: 53.6 µM vs. 0.4 µM, b: 657.6 µM vs. 87.8 µM; c: 2114 µM vs. 65.2 µM, d: 8.3 µM vs. 1.5 µM; e: 135.8 nM vs. 57.7 nM; f: 521 µM vs. 0.5 µM; g: 20.7 µM vs. 3.0 µM. Curves were compared by means of Extra-sum-of-squares F tests (**: P ≤ 0.01; ****: P ≤ 0.0001).

Figure 4. Correlation of SAMHD1 mRNA expression and sensitivity of cells to specific nucleoside analogs. Pearson correlations of SAMHD1 mRNA expression with clofarabine (a), nelarabine (b) or decitabine (c) sensitivity are shown in a panel of haematopoietic and lymphoid tissue-derived cell lines. mRNA expression data was obtained from the Cancer Cell Line Encyclopaedia (http://www.broadinstitute.org/ccle)Citation88 and area under curve (AUC) measurements from the Cancer Therapeutic Response Portal (http://www.broadinstitute.org/ctrp).Citation89,90 Pearson correlations were calculated using Prism 6 (GraphPad Software), number of XY pairs: clofarabine = 133, nelarabine = 117, decitabine = 133.

Figure 4. Correlation of SAMHD1 mRNA expression and sensitivity of cells to specific nucleoside analogs. Pearson correlations of SAMHD1 mRNA expression with clofarabine (a), nelarabine (b) or decitabine (c) sensitivity are shown in a panel of haematopoietic and lymphoid tissue-derived cell lines. mRNA expression data was obtained from the Cancer Cell Line Encyclopaedia (http://www.broadinstitute.org/ccle)Citation88 and area under curve (AUC) measurements from the Cancer Therapeutic Response Portal (http://www.broadinstitute.org/ctrp).Citation89,90 Pearson correlations were calculated using Prism 6 (GraphPad Software), number of XY pairs: clofarabine = 133, nelarabine = 117, decitabine = 133.