Figures & data
Figure 1. Hypoxia has minimal impact on colorectal cancer (CRC) cell viability after palbociclib or irinotecan treatment, as compared with 5-FU. (A) Dose-response curves of palbociclib against a panel of 5 human colon cancer cell lines under either normoxia or hypoxia, after treatment of 48 hours. (B) Tables of IC50 values with a panel of 5 human colon cancer cell lines with various molecular genetic subtypes under normoxia and hypoxia after treatment of 48 hours. Cell viability was detected with CellTiter-Glo assay. Prism statistical software was used to calculate IC50 values and plot dose-response curve. Each experiment was repeated 4 times.
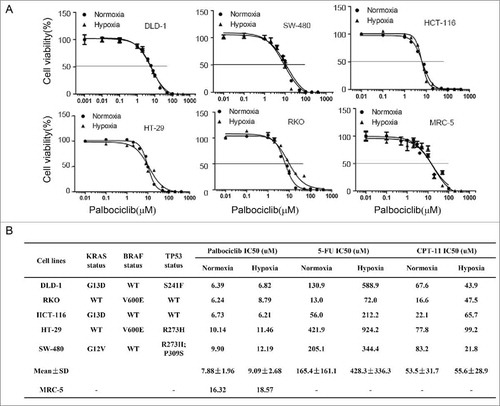
Figure 2. Effects of Palbociclib on cell death and cell cycle in CRC cell lines. RKO colon cancer cells were treated at the indicated time points with palbociclib (10 μM) under normoxic (A and C) or hypoxic (B and D) conditions. Representative curves are shown in the upper panels (A and B). Bar diagrams (C and D) represent Sub-G1 distribution within the cell cycle profiles. Data are shown as Mean ± SD (n = 3, Student's t-test, 2-tailed, “*” represents P < 0.05, “**” represents P < 0.01 (E) Immunoblotting shows cleavage of apoptosis-related proteins with or without palbociclib under either normoxia (Left panels) or hypoxia (Right panels). Cell death and cell cycle alterations are shown using flow cytometry. Cell death after treatment of 48 hours under hypoxia was significant. Thus there were not enough cells to support cell cycle analysis (B).
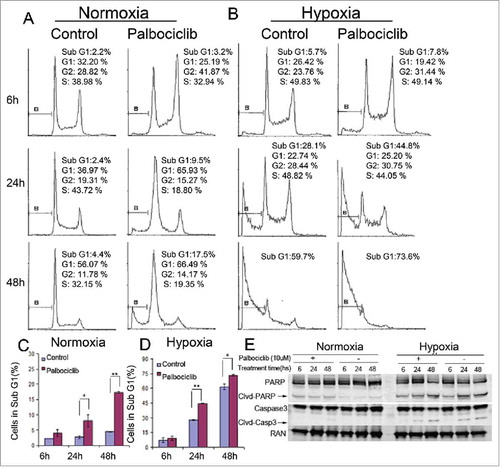
Figure 3. Palbociclib therapeutic effects against CRC cells via regulation of various cellular signaling pathways under normoxia and hypoxia. RKO colon cancer cells were treated at the indicated time points with palbociclib (10 μM) under normoxia (Left panels) and hypoxia (Right panels). Whole cell lysates were separated in 4–12% SDS-PAGE gels.
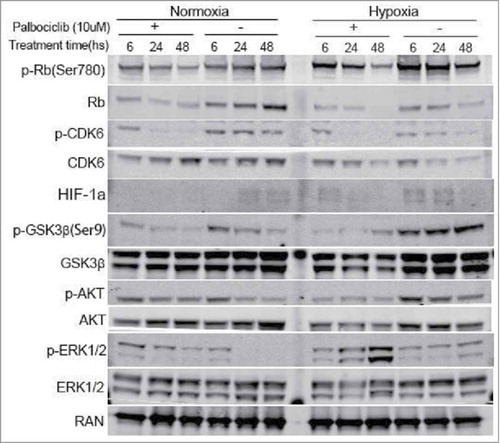
Figure 4. Synergy assessment of palbociclib in combination with a variety of chemotherapeutic agents in CRC cell lines under hypoxia. HT-29, RKO and HCT-116 CRC cell lines were treated with the indicated concentrations of palbociclib in combination with CPT11 (A and B), 5-FU (C) or Oxaliplatin (D) for 48 hours in various non-constant ratios/doses. (A) Representative fluorescent images of palbociclib in combination with CPT11 in a panel of 3 CRC cell lines are shown. Combination index (CI) <1, = 1 and >1 respectively indicate synergism, additivity or antagonism. CI < 0.5 indicates very strong synergy. Red colored numbers highlight synergy at the indicated concentrations.
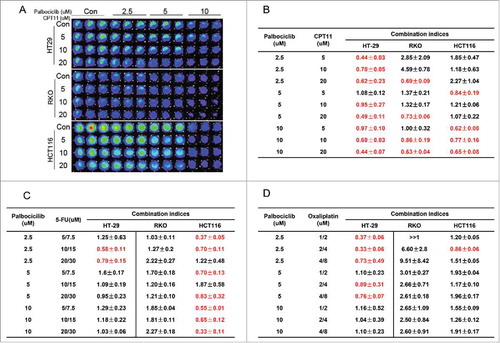
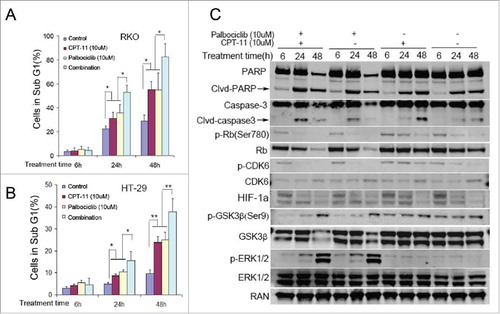
Figure 5. Palbociclib synergizes with CPT11 against CRC cell lines via deregulating CPT-11-induced Rb activation and further reducing HIF-1α accumulation under hypoxia. RKO (A and C) and HT-29 (B) CRC cell lines were treated with or without palbociclib (10 μM) in combination with CPT11 (10 μM) at the indicated time points under hypoxia. Bar diagrams (A and B) depict the sub-G1 percentage in the cell cycle profiles. Data are shown as Mean ± SD (n = 3, Student's t-test, 2-tailed, “*”represents P < 0.05, “**” represents P < 0.01). (C) Immunoblotting shows protein levels (as indicated) with or without chemotherapy under either normoxia (Left panels) or hypoxia (Right panels).