Figures & data
Figure 1. Decreased of total protein ubiquitylation in MCF7ADR compared to MCF7 cells. (A) MCF7 and MCF7ADR cells were treated (+) or not for 1h with Adriamycin (1 μM). TUBE-capture fractions were analyzed by Western blot with the indicated antibodies. (B) Detection of ubiquitylated proteins on TUBEs microarrays. Analysis of ubiquitylated proteins in MCF7 or in MCF7ADR cell extracts at different concentrations of total protein (3, 7, 12, 25, 50, and 100 μg) with (white) or without (grey) ADR treatment (1h, 1 μM) is shown. Each histogram represents the average relative fluorescence units (RFU) value of five spots for each condition. (C) Fold of ubiquitylated proteins in MCF7 and MCF7ADR cell extracts at different concentrations of total protein (3, 7, 12, 25, 50, and 100 μg) comparing the level of total ubiquitylated proteins after ADR treatment to untreated cells.
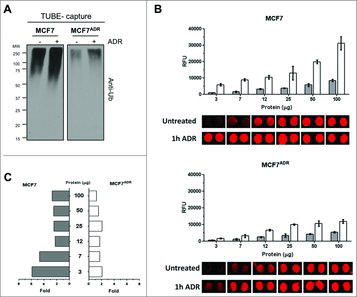
Figure 2. Ubiquitylation defects of specific proteins in MCF7ADR cells. MCF7 and MCF7ADR cells were treated with ADR (1 μM) for the indicated times, ubiquitylated proteins were captured using TUBEs and analyzed by Western blot using the indicated antibodies. Input and TUBEs-capture fractions are shown. GAPDH was used as a loading control.
Figure 3. Ubiquitin-chain profiles in ADR sensitive and resistant cell lines treated with proteasome and autophagy inhibitors. MCF7 and MCF7ADR cells were treated overnight with ADR (1 μM), MG132 (5 μM) or Chloroquine (CQ, 200 μM). Ubiquitylated forms were captured using TUBEs and bound material was eluted before being submitted to p53 immunoprecipitation as previously described Citation16. Input (A), TUBEs-IP p53 (B) and unbound fractions (FT1 and FT2) (C) were analyzed by Western blot using the indicated antibodies.
Figure 4. Proteasome inhibition promotes efficient apoptosis in MCF7ADR cells. (A) MCF7 and MCF7ADR cells were treated overnight with ADR, MG132 or PR619 (20 μM, 15 min) alone or in combination as indicated. Ubiquitylated proteins were captured using TUBEs and analyzed by Western blot. Input and TUBEs-capture fractions were shown. GAPDH was used as a loading control. (B) To track MCF7 cells undergoing apoptosis, cells were treated or not with ADR (1 μM overnight), MG132 (5 μM, overnight), or PR619 (20 μM, 15 min) alone or in combination as indicated. Data represent the mean of three independent experiments done in triplicate. A total of 10.000 events were collected and analyzed for each sample.
Figure 5. Proteasome inhibition promotes efficient apoptosis in A2780DR1 and A2780DR2 cells. (A) A2780, A2780DR1 and A2780DR2 cells were treated with ADR (2 μM) during 1 or 4 hours. Ubiquitylated proteins were captured using TUBEs and analyzed by Western blot with the indicated antibodies. Input and TUBEs-capture fractions were shown. β-actin was used as a loading control. (B) To track A2780DR1 and A2780DR2 cells undergoing apoptosis, these were treated or not during 24hrs with ADR (5 μM) or MG132 (2.5 μM) or in combination as indicated. Data represent the mean of three independent experiments.