Figures & data
Figure 1. Alteration of the airspace and histology of mouse lungs in the presence of high levels of glucose. A-B: Representative images of mouse lungs from E18.5 in the control (A) and PGDM (B) groups. C-D: The H&E-stained transverse sections of control (C) and PGDM (D) mouse lungs were taken at the levels indicated by the arrows in A-B, respectively. E-F: The PAS-stained transverse sections of control (E) and PGDM (F) mouse lungs were taken at the levels indicated by arrows in A-B, respectively. G: The point and figure chart compares mouse lung weights between the control and PGDM groups. H: The point and figure chart compares the alveolar air spaces between control and PGDM group mice. I: The point and figure chart compares the volume densities of alveolar air spaces (ratio of airspace and total volume) between control and PGDM group mice. Scale bars = 1000 μm in A-B and 50 μm in C-F. *P < 0.05, **P<0.01, ***P<0.001.
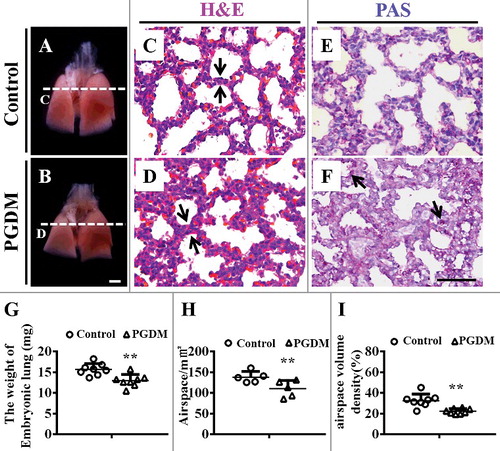
Figure 2. Assessment of cell proliferation and apoptosis of mouse lungs in the presence of high levels of glucose. A-B: PCNA immunohistochemistry was performed on the transverse sections of embryonic (E18.5) mouse lungs from the control (A) and PGDM (B) groups. All of the sections were counterstained with haematoxylin. C: The point and figure chart compares the PCNA+ cell numbers of mouse lung sections between the control and PGDM groups. D-E: TUNEL immunohistochemistry was performed on the transverse sections of embryonic (E18.5) mouse lungs from the control (D) and PGDM (E) groups. All of the sections were counterstained with haematoxylin. F: The point and figure chart compares the percentage of TUNEL+ cell of mouse lung sections between the control and PGDM groups. G: The Western blotting data show the protein expressions of PCNA, Ki67 and p53 from the lung tissues of control and PGDM mice at E18.5 embryonic days. F: The qPCR data shows the expression levels of cyclinA2, cyclinB1, cyclinD1, cyclinE1, cdk1, cdk2, cdk4, cdk6, p27 and p57 in E18.5 mouse lung tissues from the control and PGDM groups. Scale bars = 20 μm in A-B and 25 μm in D-E. *P < 0.05, **P<0.01, ***P<0.001.
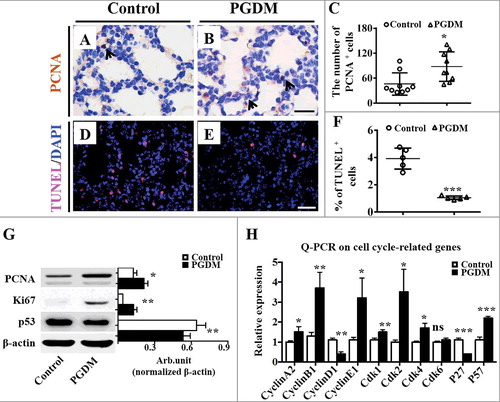
Figure 3. Assessment of mouse pulmonary fibrous tissue proliferation in the presence of high levels of glucose. A-B: Masson staining was performed on the transverse sections of embryonic (E18.5) mouse lungs from the control (A) and PGDM (B) groups. A1-B1: The high-magnification images were taken from the sites indicated by dotted squares in A-B, respectively. C-D: Decorin immunohistochemistry was performed on the transverse sections of embryonic (E18.5) mouse lungs from the control (C) and PGDM (D) groups. All of the sections were counterstained with haematoxylin. E: The Western blotting data show the protein expression levels of decorin and α-SMA from the lung tissues of control and PGDM mice at E18.5 embryonic days. F: The qPCR data show the expression levels of PDGFR-α, PDGFR-β, vimentin, SM22, α-SMA, FGF9 and FGF10 in E18.5 mouse lung tissues from the control and PGDM groups. Scale bars = 300 μm in A-B and 30 µm in A1-B1, C-D. *P < 0.05, **P<0.01, ***P<0.001.
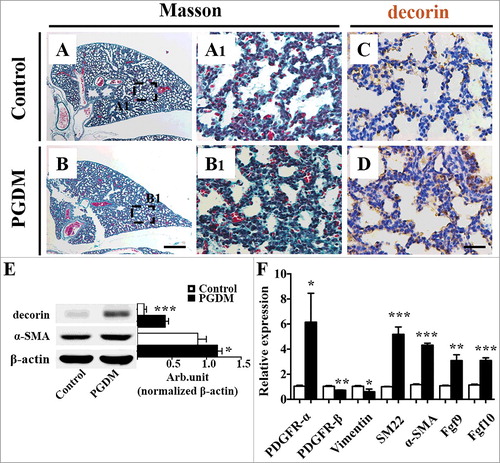
Figure 4. Expression of mouse pulmonary alveolar stem cells in the presence of high levels of glucose. A-D: pro-SPC immunofluorescent staining was performed on the transverse sections of embryonic (E18.5) mouse lungs from the control (A-B) and PGDM groups (C-D). E: The point and figure chart compares the percentages of pro-SPC+ cell numbers of mouse lung sections between the control and PGDM groups. F: The qPCR data show the expression levels of distal epithelial cell markers, including Aqp5, SPA, SPB and SPC, in E18.5 mouse lung tissues from the control and PGDM groups. G: The qPCR data show the expression levels of proximal epithelial cell markers, including Scgbla1, β-tubulin IV and Foxj1, in E18.5 mouse lung tissues from the control and PGDM groups. H: The Western blotting data show the protein expression levels of pro-SPC and Aqp5 from the lung tissues of control and PGDM mice at E18.5 embryonic days. Scale bars = 25 mm in A-B, *P < 0.05, **P<0.01, ***P<0.001.
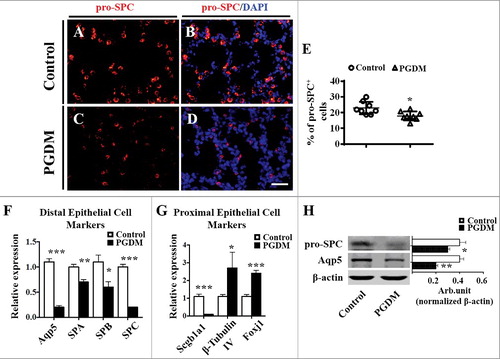
Figure 5. Expression of Wnt signalling molecules in the presence of high levels of glucose. A: The Western blotting data show the protein expression levels of β-catenin and E-cadherin from the lung tissues of control and PGDM mice at E18.5 embryonic days. B: The qPCR data show the expression levels of Wnt2, Wnt2a, Wnt5a, Wnt7a, Wnt7b, Wnt11 and Axin2 in E18.5 mouse lung tissues from the control and PGDM groups. C: The Western blotting data show the protein expression of GATA6 from the lung tissues of control and PGDM mice at E18.5 embryonic days. D: The qPCR data show the expression of GATA6 in E18.5 mouse lung tissues from the control and PGDM groups. *P < 0.05, **P<0.01, ***P<0.001.
Figure 6. Expression levels of GATA6 and AECI/AECII markers in MLE-12 cells following treatment with high glucose. A-C: pro-SPC immunofluorescent staining was performed on the cultured MLE-12 cells with 5.5 mM glucose (A, control), 50 mM glucose (B, high glucose) and 50 mM Mannitol (C, osmotic pressure control) for 48 hours. D-E: The merged images of DAPI staining+ in A-C, respectively. G: The point and figure chart compares the percentages of GATA6+ cell numbers between the control and high-glucose groups. H: The Western blotting data show the protein expression of GATA6, pro-SPC and Aqp5 in MLE-12 cells of the control and high-glucose groups. I: The qPCR data show the m-RNA level of Wnt2b, Wnt5a, Fgf9 and Fgf10 in MLE-12 cells of the control and high-glucose groups. Scale bars = 25 μm in A-F. *P < 0.05, **P<0.01, ***P<0.001.
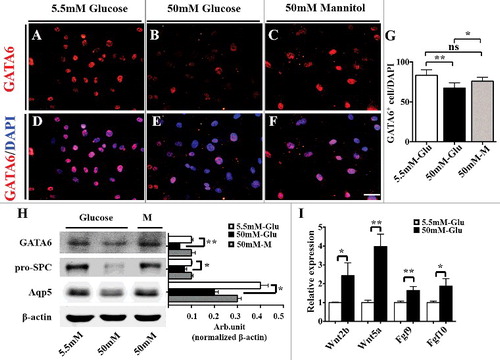
Figure 7. The expression levels of GATA6 and AECI/AECII markers in MLE-12 cells following the blockade of either FGF or Wnt signalling. A: The Western blotting data show the protein expression of GATA6, pro-SPC, α-SMA, decorin and β-actin in MLE-12 cells of the control and high-glucose groups in the presence/absence of XAV939 or su5402. B: QPCR data show the mRNA expression of TGF-β and α-SMA in MLE-12 cells of the control and high-glucose groups in the presence/absence of XAV939 or su5402. *P < 0.05, **P<0.01, ***P<0.001.
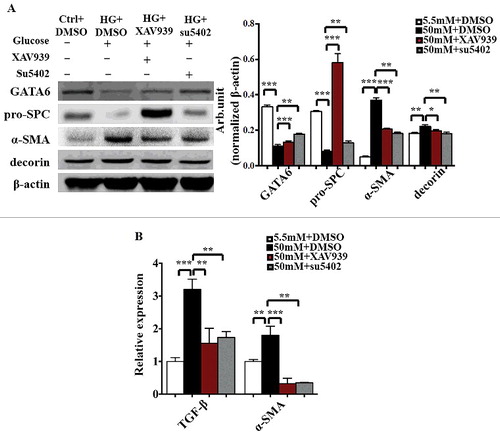
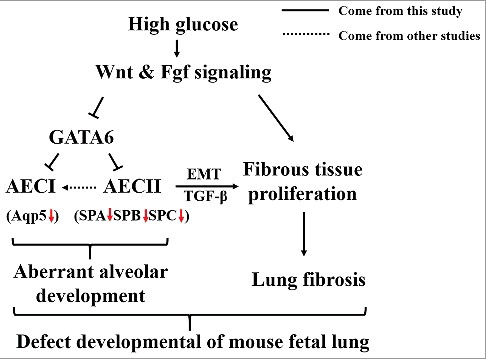
Figure 8. A proposed model that depicts the potential mechanisms for hyperglycaemia- induced defects in alveolar development.