Figures & data
Figure 1. Protofilament distribution in yeast MTs assembled under different conditions. Fraction of total MT length visualized containing different protofilament numbers (PF), as assigned by comparison with different reference models (see M&M). Total number of tubulin dimers analyzed for each condition: Dyn 1,133,455; Dyn+Bim1 46,563; GMPCPP 732,319; GTPγS 202,312; GTPγS+Bim1 201,671; Epo. 186,683; Tax. 603,552. Previously published mammalian distributions shown for comparison [Citation35].
![Figure 1. Protofilament distribution in yeast MTs assembled under different conditions. Fraction of total MT length visualized containing different protofilament numbers (PF), as assigned by comparison with different reference models (see M&M). Total number of tubulin dimers analyzed for each condition: Dyn 1,133,455; Dyn+Bim1 46,563; GMPCPP 732,319; GTPγS 202,312; GTPγS+Bim1 201,671; Epo. 186,683; Tax. 603,552. Previously published mammalian distributions shown for comparison [Citation35].](/cms/asset/aa5391b8-8e2d-4b82-bfad-680cd3cb157b/kccy_a_1415680_f0001_oc.jpg)
Figure 2. Differences at lateral contact within the MT between mammalian and yeast tubulin. (A) Cα traces for the yeast tubulin model of two adjacent tubulin dimers. The boxes correspond to the regions displayed in (B) and (C). Superposition of the yeast atomic model [Citation34] aligned with mammalian tubulin [Citation12] around the lateral contacts for β-tubulin (B) and α-tubulin (C). Residue differences between yeast and mammalian tubulin near the lateral interface are indicated. Yeast models shown in darker shades (α-tubulin in green, β-tubulin in blue). Labeled residues reference mammalian tubulin residue first. Contacts between β-tubulins are similar, while in α-tubulin the loops between helix-H1 and β-strand-S2, and between β-strand-S7 and helix-H9 (C-terminal region of the M-loop) adopt different conformations.
![Figure 2. Differences at lateral contact within the MT between mammalian and yeast tubulin. (A) Cα traces for the yeast tubulin model of two adjacent tubulin dimers. The boxes correspond to the regions displayed in (B) and (C). Superposition of the yeast atomic model [Citation34] aligned with mammalian tubulin [Citation12] around the lateral contacts for β-tubulin (B) and α-tubulin (C). Residue differences between yeast and mammalian tubulin near the lateral interface are indicated. Yeast models shown in darker shades (α-tubulin in green, β-tubulin in blue). Labeled residues reference mammalian tubulin residue first. Contacts between β-tubulins are similar, while in α-tubulin the loops between helix-H1 and β-strand-S2, and between β-strand-S7 and helix-H9 (C-terminal region of the M-loop) adopt different conformations.](/cms/asset/503dd906-3859-4ce9-b0a9-cbead0f80066/kccy_a_1415680_f0002_oc.jpg)
Figure 3. Analysis of tubulin oligomers reveals differences outside the MT lattice that may contribute to distinct dynamic instability properties of mammalian and yeast MTs. A-D) Negative stain images of (A-B) GDP and (C-D) GTP bound oligomers for (A and C) mammalian, and (B and D) yeast tubulin sources. Quantification of oligomer length (E) and curvature (F) for manually traced oligomers. The number of tubulin dimers in the mammalian oligomers does not change with nucleotide, unlike for the yeast oligomers, which are longer when GTP-bound. The majority of yeast oligomers are less curved when GTP-bound than when GDP-bound, unlike the mammalian tubulin (Mann-Whitney test p < 1 × 10⁻⁵ between mammalian and yeast GTP-bound oligomers, and Mann-Whitney test p < 1 × 10⁻³ between mammalian and yeast GDP-bound oligomers). Scale bar 50 nm. n > 200 for each condition.
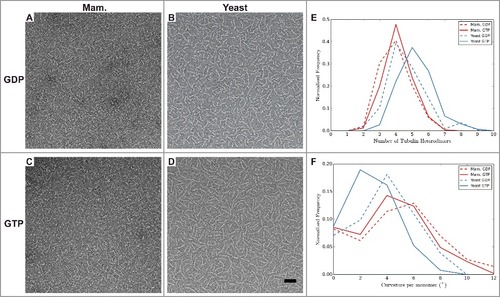
Figure 4. Long extensions observed for dynamic yeast MTs. Examples of long extensions of tubulin from the ends of MTs. Curvature (degrees per monomer) for one of these extensions is indicated, and corresponds closely to that most commonly observed for GTP-bound yeast oligomers (see F). Many of these extensions appear to be more than one protofilament wide. Scale bar 50 nm. MTs are decorated with kinesin motor domain.
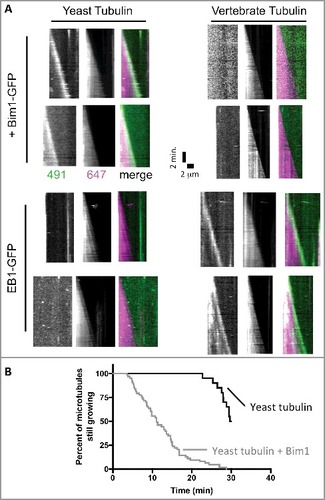
Figure 5. The plus-end tracking activity of Bim1 and EB1 shows species specificity. (A) Kymographs showing the behavior of Bim1-GFP (top rows) or EB1-GFP (bottom rows) on yeast (left columns) or bovine (right columns) microtubules labeled with Alexa-647. GFP and 647 channels are shows separately in greyscale, with the corresponding merged image in color. Robust tracking was only observed for ‘all yeast’ or ‘all mammalian’ combinations of EB and tubulin. All microtubules in the assay behaved consistently with the two representative microtubules shown for each condition. (B) Survival curve representing the percentage of microtubules still growing at the indicated time. Under the conditions of our assay, yeast microtubules were relatively long-lived in the absence of Bim1 (black curve; only 10 of 20 microtubules measured underwent catastrophe from the 20 axonemes monitored during the 30 minute recording). Addition of Bim1-GFP greatly increased the frequency of catastrophe (64 catastrophes recorded from the 20 axonemes monitored).