Figures & data
Figure 1. Chromosome 2p11.2-2p25.3 gain in human neuroblastoma tissues. SNP array data originally generated by the TARGET initiative (https://target-data.nci.nih.gov/) and the CHOP Copy Number Variance project were analysed. Chromosome amplification frequencies in neuroblastoma tissues, compared with blood and bone marrow samples from the neuroblastoma patients and blood samples from healthy children, at different regions of chromosome 2 were plotted against all genomic locations, including the following representative regions: Chr2p11.2 (A), Chr2p14 (B), Chr2p15 (C), Chr2p16.1 (D), Chr2p16.3 (E), Chr2p21 (F), Chr2p24.3 (G) and Chr2p25.3 (H). Tumour = tumour samples; Blood and bone marrow from patients = normal blood and bone marrow samples from neuroblastoma patients; Blood from control = blood samples from heathy children from The Children's Hospital of Philadelphia.
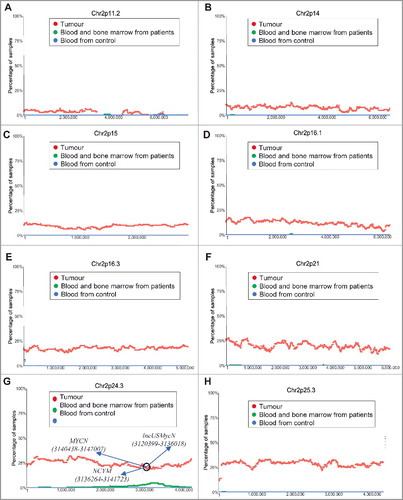
Figure 2. Chromosome 17q11.1-17q25.3 gain in human neuroblastoma tissues. SNP array data originally generated by the TARGET initiative and the CHOP Copy Number Variance project were analysed. Chromosome gain frequencies in neuroblastoma tissues, compared with blood and bone marrow samples from the neuroblastoma patients and blood samples from healthy children, at different regions of chromosome 17 were plotted against all genomic locations, including the following representative regions: Chr17q11.1 (A), Chr17q11.2 (B), Chr17q12 (C), Chr17q21.1 (D), Chr17q21.2 (E), Chr17q21.31 (F), Chr17q21.32 (G) and Chr17q25.3 (H). Tumour = tumour samples; Blood and bone marrow from patients = normal blood and bone marrow samples from neuroblastoma patients; Blood from control = blood samples from heathy children from The Children's Hospital of Philadelphia.
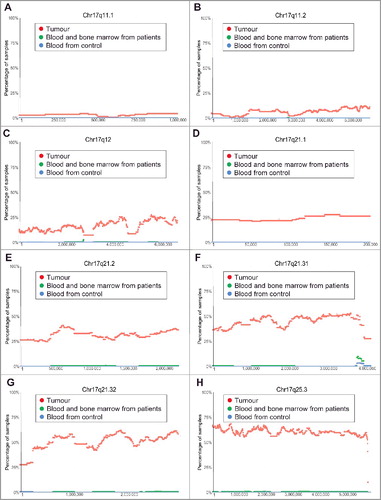
Figure 3. Chromosome 1p13.3-1p36.33 deletion in human neuroblastoma tissues. SNP array data originally generated by the TARGET initiative and the CHOP Copy Number Variance project were analysed. Chromosome deletion frequencies in neuroblastoma tissues, compared with blood and bone marrow samples from the neuroblastoma patients and blood samples from healthy children, at different regions of chromosome 1p were plotted against all genomic locations, including the following representative regions: Chr1p13.2 (A), Chr1p13.3 (B), Chr1p21.1 (C), Chr1p22.3 (D), Chr1p31.2 (E) and Chr1p36.33 (F). Tumour = tumour samples; Blood and bone marrow from patients = normal blood and bone marrow samples from neuroblastoma patients; Blood from control = blood samples from heathy children from The Children's Hospital of Philadelphia.
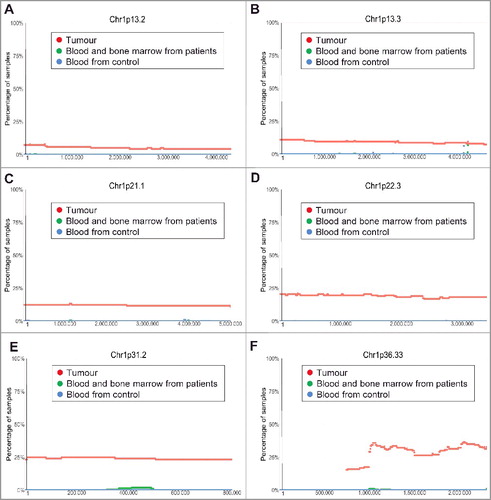
Figure 4. Chromosome 11q13.3-11q25 deletion in human neuroblastoma tissues. SNP array data originally generated by the TARGET initiative and the CHOP Copy Number Variance project were analysed. Chromosome deletion frequencies in neuroblastoma tissues, compared with blood and bone marrow samples from the neuroblastoma patients and blood samples from healthy children, at different regions of chromosome 11q were plotted against all genomic locations, including the following representative regions: Chr11q13.3 (A), Chr11q13.4 (B), Chr11q14.1 (C), Chr11q22.3 (D), Chr11q 23.1 (E) and Chr11q25 (F). Tumour = tumour samples; Blood and bone marrow from patients = normal blood and bone marrow samples from neuroblastoma patients; Blood from control = blood samples from heathy children from The Children's Hospital of Philadelphia.
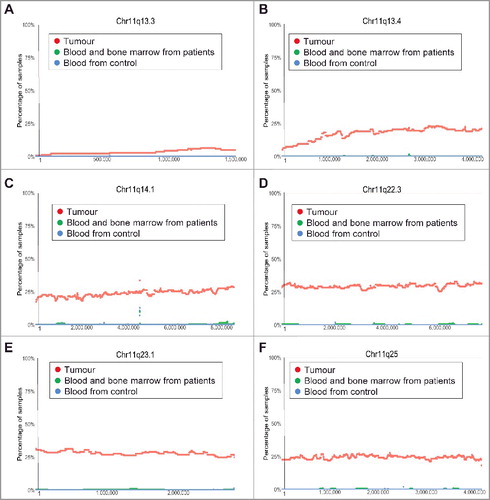
Figure 5. Chromosomes 7q14.1 and 14q11.2 focal deletion in blood and bone marrow samples from neuroblastoma patients. (A) and (B) SNP array data originally generated by the TARGET initiative and the CHOP Copy Number Variance project were analysed. Chromosome deletion frequencies in blood and bone marrow samples from neuroblastoma patients, compared with neuroblastoma tissues and blood samples from healthy children, at different regions of chromosome 7q14.1 (A) and 14q11.2 (B) were plotted. Tumour = tumour samples; Blood and bone marrow from patients = normal blood and bone marrow samples from neuroblastoma patients; Blood from control = blood samples from heathy children from The Children's Hospital of Philadelphia. (C) and (D) Genes located at Chr7:38254795-38346971 (C) or Chr14:21637401-22024617 (D), according to University of California Santa Cruz Genome Browser.
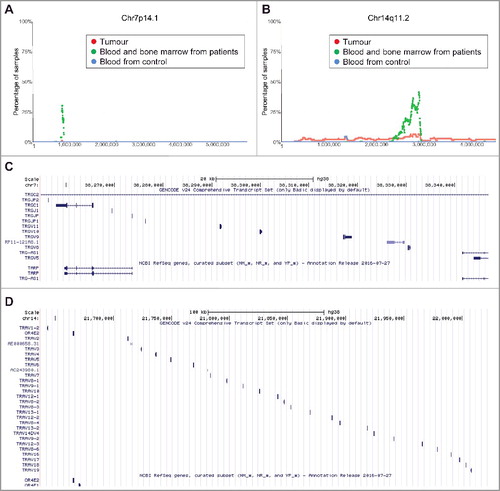
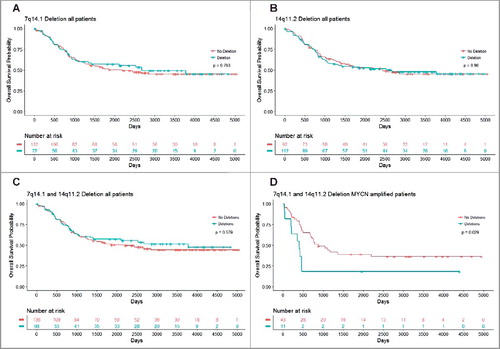
Figure 6. Chromosomes 7q14.1 and 14q11.2 focal deletions in blood and bone marrow samples from MYCN-amplified neuroblastoma patients predict poor survival. Kaplan Meier curve for overall survival in all patients with Chr7q14.1 deletion (A), Chr14q11.2 deletion (B) or both Chr7q14.1 and Chr14q11.2 deletions (C), and in MYCN-amplified neuroblastoma patients with focal deletions at both 7q14.1 and 14q11.2 (D).