Figures & data
Figure 1. Lactate promotes M2-like macrophage polarization. (A) The relative mRNA expression of M2-like macrophages was analyzed by QPCR in BMDMs with or without lactate treatment for 12 h (n = 3). *P < 0.05. (B) Western blot for Arg-1 and MRC-1 in BMDMs after treatment with lactate for 24 h. β-actin was used as a loading control. The Arg-1/β-actin or MRC-1/β-actin ratio was quantified and is shown as fold changes compared with control (n = 3). *P < 0.05, **P < 0.01 compared with control. (C) The relative mRNA expression of M2-like macrophages was analyzed by QPCR in THP-1 cells with or without lactate treatment for 12 h (n = 3). *P < 0.05. (D) Western blot for CD206 in THP-1 cells after treatment with lactate for 24 h. β-actin was used as a loading control. The CD206/β-actin ratio was quantified and is shown as fold changes compared with control (n = 3). *P < 0.05, **P < 0.01 compared with control group.
Figure 2. Lactate-activated macrophages promote cancer cell migration and angiogenesis in vitro. (A) MCF7 cells were treated with the conditioned medium (CM) from THP-1 cells treated with or without lactate and monitored by live imaging; Scale bar represents 50 μm. Confluence was quantified and compared with control (B) wound-healing migration assay of MCF7 cells migration. (C,E and F) Boyden chamber assay of MDA-MB-231 cells(C), MCF7 cells (E), and pHUVECs(F) migration. Cells were plated on the upper chamber inserts with serum-free medium, and CM from control THP-1 cells or lactate-activated THP-1 cells were put in the lower chambers. After migration for 6 h (F) or 24 h (C, E), the migrated cells were stained with crystal violet and counted as cells per field of view under the microscope (n = 5). (D,G) Lactate-activated THP-1 cells induced the proliferation of MCF7 cells(D) and pHUVECs(G). (H) Lactate-activated macrophage induced capillary-structure formation of endothelial cells. pHUVECs were placed in 96-well plates coated with Matrigel (2.0 × 10⁴ cells/well) and stimulated with CM from THP-1 cells that were treated with or without lactate. After 6 h, tubular structures were photographed (magnification, × 100).*P < 0.05, **P < 0.01 compared with control group.
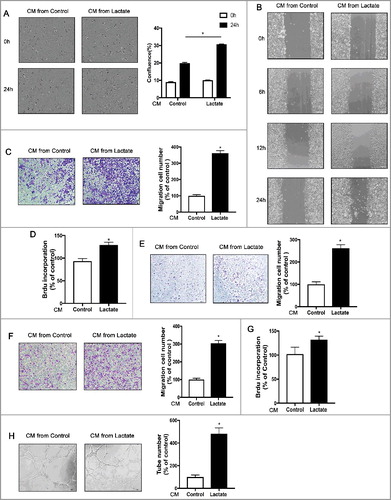
Figure 3. Macrophage phenotypic switch induced by lactate is associated with increased ERK/STAT3 signaling. (A and B) THP-1 cells were stimulated with lactate or PBS for 24 h (A) or a different time (B). Expression and phosphorylation levels of ERK1/2 and STAT3 in THP-1 cells were determined by Western blots. (C and D) The relative mRNA expression of M2-like macrophages was analyzed by QPCR in BMDM(C) and THP-1 cells(D) which were pretreated with Selumetinib (10 mM) or/and Stattic (10 mM) for 30 min and then exposed to lactate or PBS for 12 h (n = 3). *P < 0.05 compared with control. (E) THP-1 cells were pretreated with Selumetinib (10 mM) and Stattic (10 mM) for 30 min and then exposed to lactate or PBS for 24 h. Phosphorylation levels of ERK1/2 and STAT3 in macrophages were determined by Western blot. Data are representative of results obtained in three independent experiments. *P < 0.05, **P < 0.01 compared with control group; #P < 0.05 compared with lactate group.
Figure 4. Inhibition of the ERK/STAT3 signaling impedes breast cancer migration and angiogenesis by suppressing Lactate-induced M2 macrophage polarization. (A) MCF7 cells were treated with the conditioned medium (CM) from macrophages which were pretreated with Selumetinib (10 mM) and Stattic (10 mM) for 30 min and then treated with lactate or PBS and monitored by live imaging, Scale bar represents 50 μm. Confluence was quantified and compared with control. (B, C and E) Boyden chamber assay of the MDA-MB-231 cell (B), and pHUVEC (C,E) migration. Cells were plated on the upper chamber inserts with serum-free medium, and CM from control macrophages or lactate-activated macrophages which were pretreated with Selumetinib (10 mM) and Stattic (10 mM) for 30 min was put in the lower chambers. After migration for 6 h(C) or 24 h(B), the migrated cells were stained with crystal violet and counted as cells per field of view under the microscope (n = 5). (D) The proliferation of pHUVECs induced by lactate-activated macrophages was suppressed by inhibition of the ERK/STAT3 signaling. pHUVECs cells were treated with cultured medium(CM) from macrophages which were pretreated with Selumetinib (10 mM) and Stattic (10 mM) for 30 min and then treated with lactate or PBS. (F and G) Capillary-structure formation of endothelial cells induced by lactate-activated macrophages was suppressed by inhibition of ERK/STAT3 signaling. pHUVECs were placed in 96-well plates coated with Matrigel (2.0 × 10⁴ cells/well) and stimulated with CM from macrophages which were pretreated with Selumetinib (10 mM) and Stattic (10 mM) for 30 min and then treated with lactate or PBS. After 6 h, tubular structures were photographed (magnification, × 100). *P < 0.05, **P < 0.01 compared with control group; #P < 0.05 compared with lactate group.
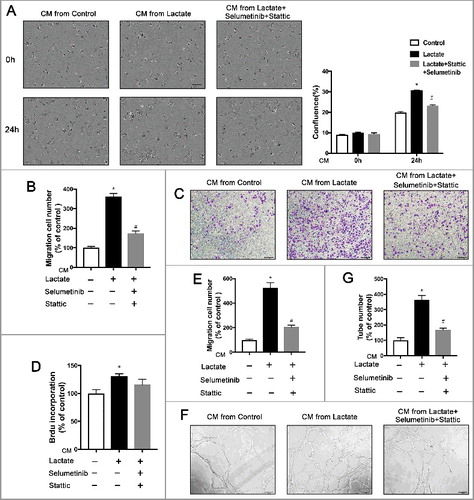
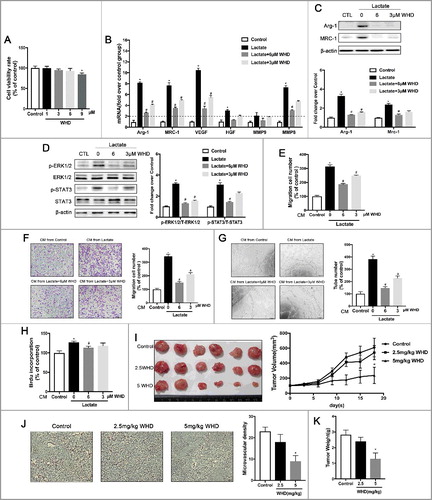
Figure 5. WithaD suppresses breast cancer growth and angiogenesis by impeding lactate-induced M2 macrophage polarization via the ERK/STAT3 signaling pathway. (A) The cell viability was detected by the CCK8 assay. BMDMs were treated with different concentrations of WithaD for 24 h. (B) WithaD suppresses M2-like macrophage polarization induced by lactate. The relative mRNA expression of M2-like macrophages was analyzed by QPCR in BMDMs pre-treated with WithaD for 30 min and then with or without lactate treatment for 12 h (n = 3). *P < 0.05. (C) Western blot for Arg-1 and MRC-1 in BMDMs stimulated by lactate for 24 h after pretreated with WithaD for 30 min. β-actin was used as a loading control. The Arg-1/β-actin or MRC-1/β-actin ratio was quantified and is shown as fold changes compared with control (n = 3). *P < 0.05, **P < 0.01 compared with control. (D) BMDMs were pretreated with WithaD for 30 min and then were stimulated with lactate or PBS for 24 h. Expression and phosphorylation levels of ERK1/2 and STAT3 in BMDMs were determined by Western blot. (E and F) Boyden chamber assay of the MDA-MB-231 cell (E), and pHUVEC (F) migration. Cells were plated on the upper chamber inserts with untreated (Control) media, and culture medium(CM) from lactate-activated macrophages which were pretreated with different concentration of WithaD for 30 min was put in the lower chambers. After migration for 6 h(F) or 24 h(E), the migrated cells were stained with crystal violet and counted as cells per field of view under the microscope (n = 5). (G) Capillary-structure formation of endothelial cells induced by lactate-activated macrophages was suppressed by WithaD. pHUVECs were placed in 96-well plates coated with Matrigel (2.0 × 10⁴ cells/well) and stimulated with CM from macrophages which were pretreated with WithaD for 30 min and then treated with lactate or PBS. After 6 h, tubular structures were photographed (magnification, × 100). (H) The proliferation of pHUVECs induced by lactate-activated macrophages was suppressed by WithaD. pHUVECs cells were treated with CM from macrophages which were pretreated with WithaD for 30 min and then treated with lactate or PBS. (I-K) WithaD suppressed tumor growth and angiogenesis by suppressing lactate-induced M2 macrophage polarization. (I) WithaD suppressed tumor growth. Photographs of different treatment group tumors, along with the graph of tumor volume and tumor weight (K). (J) Immunohistochemistry of tumor slides stained with antibodies against vWF; arrows show new blood vessels in the tumor, with the statistical results of microvessels on the right. *P < 0.05, **P < 0.01 compared with control group; #P < 0.05 compared with lactate group.