Figures & data
Table 1. Saccharomyces cerevisiae strains used in the study
Figure 1. DAPI staining of BY4741 (rho+) and BY4741 (rho°) budding yeast cells. Yeast strains rho+ (a) and rho° (b) were observed under DAPI staining (top panel) and DIC (bottom panel). The white arrows indicate nucleolar DNA and the red arrows indicate mitochondrial DNA. The figure presents representative photographs for rho+ and rho° (1000× magnification)
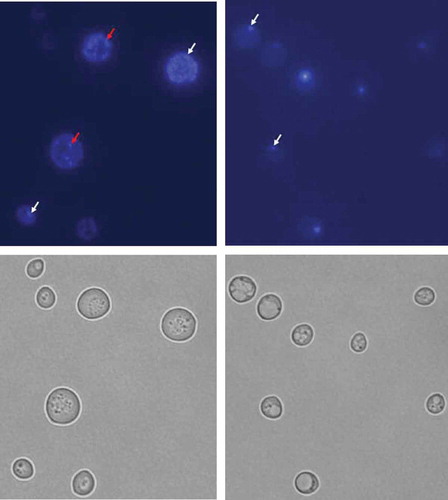
Figure 2. Comparison of the budding lifespan (a) and the total lifespan (b) of the haploid wild-type yeast strain BY4741, isogenic mutant strains lcl1Δ, lcl2Δ and bud1Δ (rho+ and rho°) and clones generates as daughters of an old mother. The values in parentheses are the mean values (for total 80 cells from two independent experiments) of the budding lifespan (a) and the total lifespan (b). Statistical significance was assessed using ANOVA and the Dunnett’s post-hoc test (*<0,01**p < 0.05, ***p < 0.001)
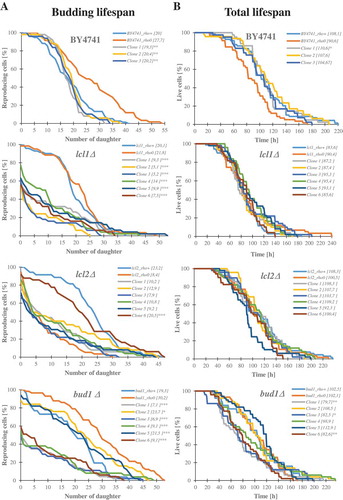
Figure 3. Scatter plots present relationship between: the mean number of daughters (budding lifespan) and the mean lengths of the total lifespan (a), the mean number of daughters (budding lifespan) and post-reproductive lifespan (b), reproductive lifespan and post-reproductive lifespan (c). Each dot represents strains or clones
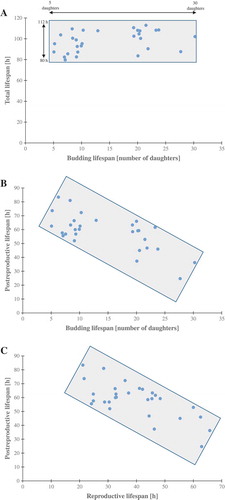
Figure 4. The growth curves of the haploid wild type yeast strain BY4741, isogenic mutant strains lcl1Δ, lcl2Δ and bud1Δ (rho+ and rho0) and clones generated as daughters of an old mother. Graphic representation of cell growth in rich YPD (Yeast extract, Peptone, Dextrose) medium (a). Growth of mutant yeast strains on various carbon sources. Yeast cells were spotted onto agar plates with YP medium supplemented with dextrose and glycerol; growth was continued for 3 days (b). The presented data are replicates from two independent cultures ± SEM where these are larger than the symbol dimensions. The data for each condition are representative of at least two independent experiments performed on different days
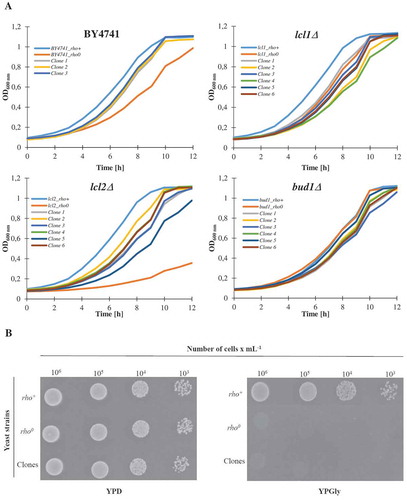
Figure 5. Evaluation of genomic instability at the karyotype level (a) and DNA double-strand breaks level (b) A. Electrophoretic karyotyping (PFGE separation) of haploid wild-type yeast strain BY4741, isogenic mutant strains lcl1Δ, lcl2Δ and bud1Δ (rho+ and rho°) and clones generated as daughters of an old mother. B. DNA double-strand breaks (DSBs) assessment was performed using neutral comet assay. As a DNA damage marker, the %tail DNA was used. The bars indicate SEM, n = 100, *p < 0.05, **p < 0.01, ***p < 0.001 compared to the rho+ strain, #p < 0.05, ##p < 0.01, ###p < 0.001 compared to the rho° strain (ANOVA and Dunnett’s a posteriori test). The typical micrographs are shown (bottom). DNA was visualised using YOYO-1 staining (green)
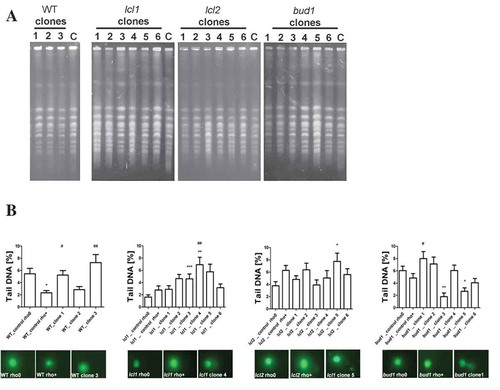
Figure 6. Evaluation of lifespan-mediated changes in nucleolus in haploid wild-type yeast strain BY4741, isogenic mutant strains lcl1Δ, lcl2Δ and bud1Δ (rho+ and rho°) and clones generated as daughters of an old mother. (a) Analysis of rDNA content. rDNA was visualised using WCPP specific to chromosome XII that contains rDNA locus in yeast. Fluorescence signals of chromosome XII were quantified using the ImageJ software. The integrated fluorescence density is presented in relative fluorescence units (RFUs). Box-and-whisker plots are shown, n = 100. The typical micrographs are shown (bottom). *p < 0.05, **p < 0.01, ***p < 0.001compared to the rho+ strain, #p < 0.05, ##p < 0.01, ###p < 0.001 compared to the rho° strain (ANOVA and Dunnett’s a posteriori test). The cells were labelled with FITC to detect chromosome XII-specific signals (green). DNA was visualised using DAPI staining (blue). (b) Silver staining of nucleolar organiser region-based analysis of nucleolus fragmentation. Fragmented nucleoli were scored (%). The typical micrographs are also shown (bottom)
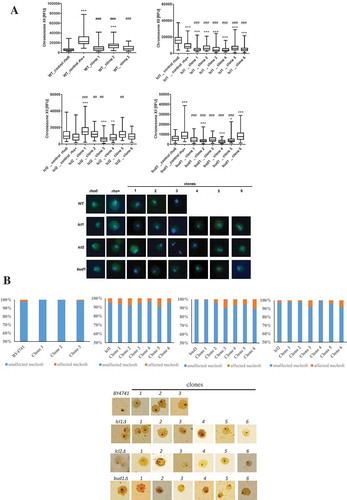
Figure 7. Polysome profile analyses using equal numbers of cells. The positions of individual ribosomal subunits are indicated in all graphs. More details about the polysome profile are available on supplementary data 3
Figure 8. Analysis of the variability in the gene copy number of strains bud1Δ rho+, rho° and two clones 3 and 5 using array CGH. Each gray dot represents the value of the log2 ratio for an individual gene. Blue lines were provided to emphasise the most accented differences (DNA losses and gains)
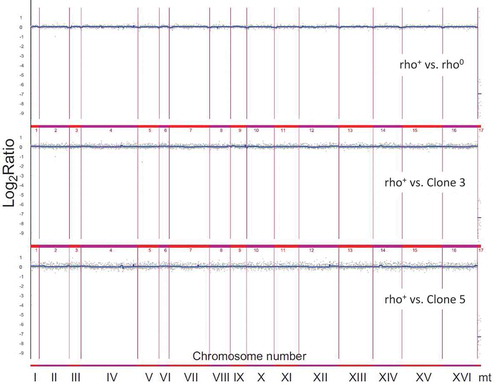
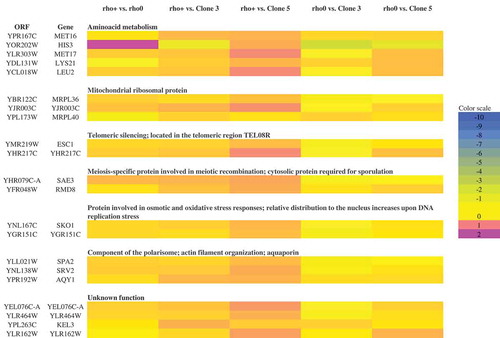
Figure 9. A heat map generated from array-CGH data. Functional categories overrepresented in the group of genes (according to their functional assignment) that were the most divergent among analysed strains are shown