Figures & data
Table 1. IGF1R immunostaining results of patients with colorectal cancer
Figure 1. Expression of IGF1R in colorectal cancer, IGF1R-targeted miRNA prediction, as well as the expression of let-7 miRNA in CRC. (a) Immunohistochemical analysis of the expression of IGF1R in: a, adjacent normal tissues; b, moderately-differentiated CRC and c, pooly-differentiated CRC. (b) Let-7 miRNA family has the highest probability score among the predicted miRNA targeting IGF1R using TargetScanHuman 6.2. (c) qRT–PCR analysis of let-7 miRNA family in total RNA from CRC tissues and paired adjacent normal tissues. The data shown are average fold changes (the mean ± SD of three independent experiments) of individual miRNA expression CRC tissues relative to normal tissues. (d) qRT–PCR analysis of let-7 miRNA family in total RNA from indicated colon cancer cell lines and the normal colon epithelial line CRL-1831. The data shown are average fold changes (the mean ± SD of three independent experiments) of individual miRNA expression in each colon cancer line relative to CRL-1831 cells. *P < 0.05; **P < 0.01. Scale bar, 25 μm
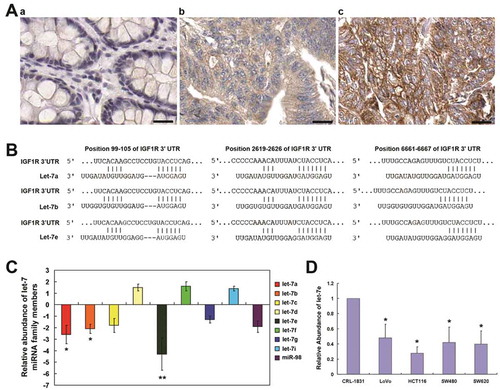
Figure 2. Effects of Let-7e on the expression of IGF1R. HCT-116 and LoVo human colorectal cancer cells were transfected with let-7e mimic or antagomir for 48 h. The expression levels of IGF1R were examined by Western blotting as described in the Methods section. Results shown are representative of at least three independent experiments
Figure 3. The effects of let-7e on cell proliferation, apoptosis, migration and cell invasion. After transfected with let-7e mimic, the changes in cell proliferation (a), cell-apoptosis rate (B), cell migration and invasion (c) were examined as described in the Methods section. All results shown are means ± SD from at least three independent experiments. *P < 0.05; **P < 0.01. Scale bar, 50 μm
Figure 4. Effects of let-7e on activation of Akt. HCT-116 and LoVo human colorectal cancer cells were transfected with let-7e mimic or IGF1R siRNA for 48 h. The levels of total Akt (pan-Akt) and p-Akt (Thr308 and Ser473) were examined by Western blotting as described in the Methods section. Results shown are representative of at least three independent experiments
Figure 5. Negative feedback regulation between microRNA let-7e and IGF1/IGF1R. (a) Let-7 miRNA family is among the predicted miRNA targeting IGF1 using TargetScanHuman 6.2. (b) qRT–PCR analysis of let-7a, let-7b and let-7e in total RNA from HCT-116 colorectal cancer cell line after stimulated with IGF1 (50 ng/ml) for the indicated time. The data shown are average fold changes (the mean ± SD of three independent experiments) of individual miRNA expression relative to vehicle-treated cells. *P < 0.05. (c) Schematic diagram showing that activation of IGF1/IGF1R pathway can inhibit let-7e expression, and on the other hand over-expression of let-7e can inhibit the expression of IGF1 and IGF1R. * indicates a let-7e target predicted by TargetScanHuman 6.2 tool, but not validated experimentally in the present study