Figures & data
Figure 1. gsHFSCs in vitro isolation pipeline and characterization. (A) Schematic diagram of the Cashmere gsHFSCs in vitro culture and single hair follicle in vitro agar based 3-D culture system. (B) Representative images obtained from anagen and telogen Shaanbei White Cashmere goat back skin. Scale bar, 1.5 cm. (C) Representative image of anagen Cashmere goat secondary hair follicles and in vitro cultured gsHFSCs. Scale bar, 400 μm. (D) Co-immunofluorescent staining of the hair follicle stem cell markers ITGB1, K15, CD34 and non-hair follicle stem cell marker K10 in gsHFSCs. Scale bar, 50 μm
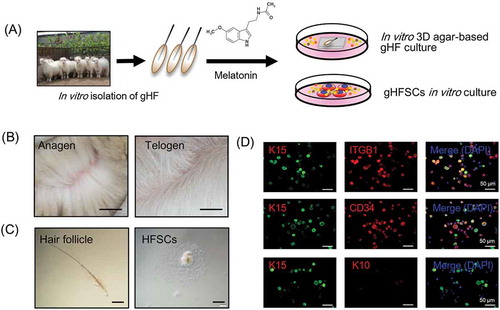
Figure 2. Effects of melatonin exposure on gsHFSCs proliferation and single hair follicle morphological changes. (A) Representative images depicting gsHFSCs morphology after exposure to different concentrations of melatonin at 24h. Scale bar, 200 μm. (B) Cell viability analysis of different concentrations of melatonin on gsHFSCs proliferation following 24 and 36 h exposure. (C) Flow cytometry and immunofluorescence analysis of EdU positive gsHFSCs after 0 and 500 ng/L melatonin exposure at 36 h. (D) Scheme diagram for in vitro 3D agar-based goat single hair follicle culture system. (E) Microscopic comparison of hair shafts between the control and 500 ng/L melatonin exposed Cashmere goat secondary hair follicles. Cashmere goat hair follicles were culture in agar based 3-D culture system for a week. Scale bar, 40 μm. (F) TEM pictures of Cashmere goat secondary hair follicle dermal papilla after melatonin exposure. Scale bar, 2 μm. (G) TEM pictures of Cashmere goat secondary hair follicle outer root sheath. Scale bar, 2 μm
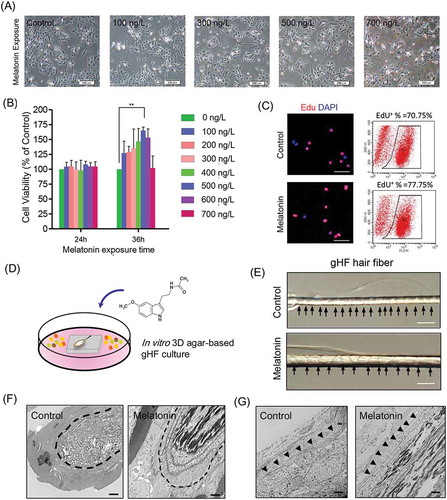
Table 1. High sequencing data quality control
Figure 3. mRNA and lncRNA sequencing data comparison and distribution. (A) Detailed schematic diagram of the lncRNA sequencing pipeline used in this study. (B) Raw reads classification and distribution of all samples in this study. (C) Genome wide distribution of differentially expressed mRNAs and lncRNAs. Chromosomes were labeled with serial number (scale Mb) and the red and blue histogram indicates p-value of differentially expressed mRNAs and lncRNAs individually. (D) Comparison of exon number, transcript length, open reading frame length between lncRNAs and mRNAs. Pearson correlations between samples were also analyzed
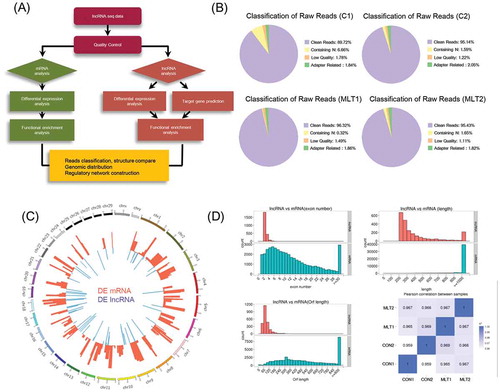
Figure 4. GO analysis and KEGG enrichment of differentially expressed mRNAs. (A) Heatmap of melatonin mediated differentially expressed mRNAs, red indicated an increased expression, and blue indicated a decreased expression. (B) Genome wide visualization of protein interactive network by Circos. From inside to outside, blue links indicate protein-protein interactive according to STRING database, orange histogram indicates p-value of differentially expressed mRNAs, combined heatmap of differentially expressed mRNAs between samples, the outer track indicates the control group and the inner track indicates melatonin exposed group. (C) GO analysis of differentially expressed mRNAs, the top 20 GO terms were shown. (D) KEGG pathway enrichment analysis of differentially expressed mRNAs, the top 20 pathways were illustrated as bubble plot. The size of the bubble indicates gene number and the color indicates q-value. (E) Protein to protein interactive network of differentially expressed mRNAs visualized Cytoscape. The color indicates node degree
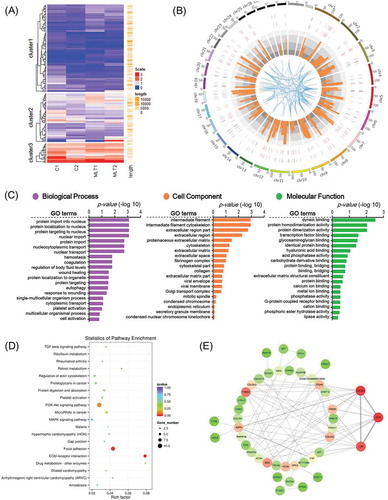
Figure 5. lncRNA analysis perturbed by melatonin exposure. (A) Heatmap of differentially expressed lncRNAs, red indicated an increased expression, and blue indicated a decreased expression. (B) Veen diagram comparison of differentially expressed mRNAs and differentially expressed lncRNA cis targeted mRNAs. The box indicates KEGG enrichment of its corresponding population. (C) Genomic location of lncRNA TCONS_00255106 and TCONS_00206163 and their potential cis targeted mRNAs. (D) Relative expression (FPKM) comparison of lncRNA TCONS_00255106, TCONS_00206163 and mRNA THBS2, COL4A2.
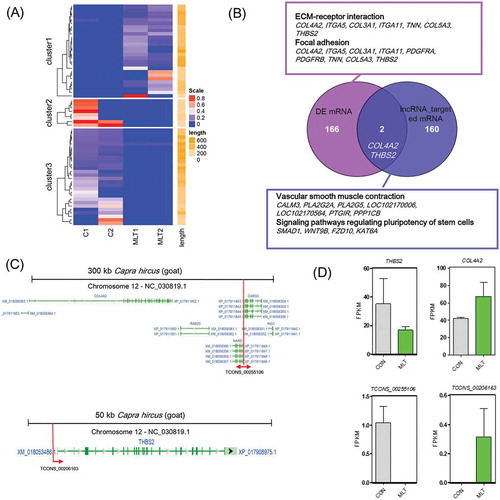
Figure 6. lncRNA and mRNA interactive network. The predicted lncRNA and mRNA network was visualized by Cytoscape, the green nodes indicate mRNAs and the red and blue nodes indicate lncRNAs. The lncRNA TCONS_00255106, TCONS_00206163 (red node) showed direct correlate to differentially expressed mRNA while the remaining lncRNAs (blue node) targeted predicated potential mRNAs
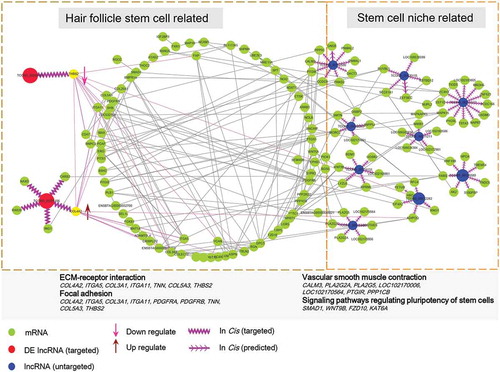
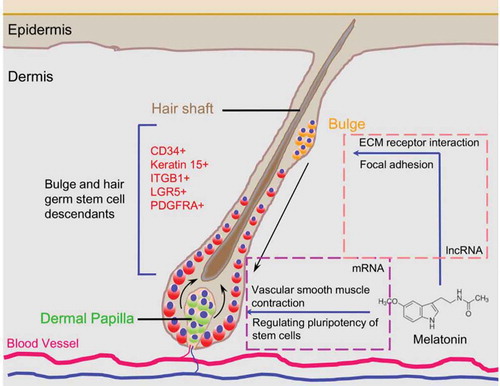
Figure 7. Proposed diagram for melatonin mediated Cashmere secondary hair follicle growth