Figures & data
Figure 1. Sirt7 forms a complex with Suv39h1. (A) HEK293T cells were transfected with EGFP-Suv39h1 and Flag-Sirt7 constructs, harvested 48 h post-transfection and subjected to immunoprecipitation using an anti-EGFP antibody or a non-immune IgG as negative control, as indicated. The experiments were performed in presence of benzonase (0.15 U/µL) to degrade nucleic acids (upper panel). The inputs are shown in the lower panel. A representative picture of 3 independent experiments is shown. Antibodies used for WB analysis are indicated on the left. (B) Primary MEFs were immunoprecipitated as in (A) using anti-Suv39h1 antibody or IgG as a negative control. The immune-complexes were resolved by western blot and reacted with anti-Sirt7 and anti-Suv39H1 antibodies as indicated (upper panel). The inputs are shown in the lower panel. A representative image of 3 independent experiments is shown. (C) Co-localization of Myc-Suv39h1 and YFP-Sirt7 in U2OS cells. U2OS cells were subjected to immunofluorescence staining 48 h post-transfection. Pictures were captured with a Sp8 confocal microscope (Leica). Scale bar 10µm.
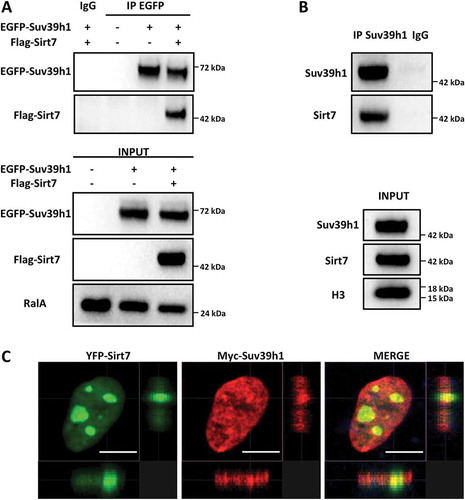
Figure 2. Inactivation of Sirt7 increases Suv39h1 activity. (A, B) Increased levels of H3K9me3 (A) and HP1α (B) in Sirt7 knockout MEFs (Sirt7 KO) visualized by immunofluorescence. Nucleoli were visualized by nucleophosmin (NPM) staining (A). Scale bars 10µm. Quantifications are shown in the panel on the right. (C) Western blot analysis of increased H3K9me3 levels indicates increased Suv39h1 activity after stable knockdown of Sirt7 in U2OS cells. Quantifications of H3K9me3 (upper panel) and Suv39h1 (lower panel) levels are shown on the right. Note that the increased H3K9me3 level in Sirt7 knockdown cells is reverted by knockdown of Suv39h1. The graph represents the average ± standard deviation of 4 independent experiments using four different, independently derived stable cell lines. *p < 0.05, **p < 0.01, NS: not significant.
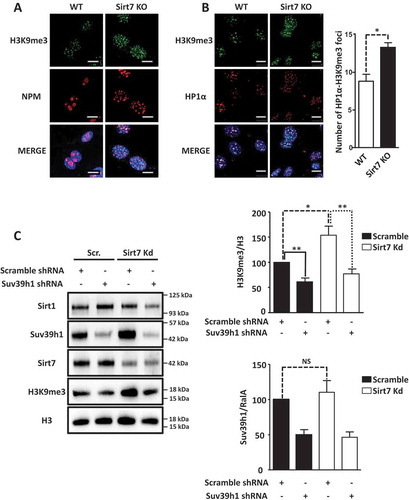
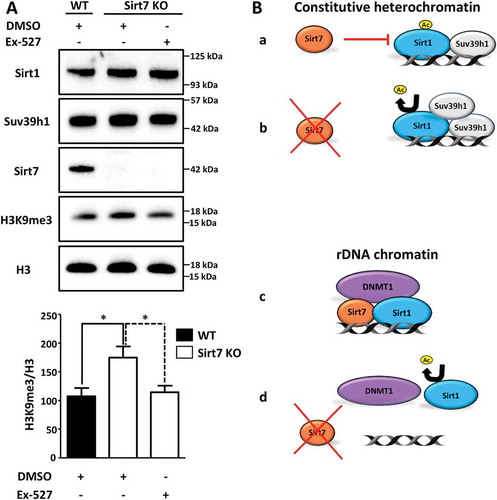
Figure 3. Hyperactive Sirt1 stimulates Suv39h1 activity. (A) Western blot analysis showing that overexpression of Sirt7 in HEK293T cells prevents Sirt1-mediated activation of Suv39h1. 48 h after transfection, cells were harvested and subjected to western blot analysis using the indicated antibodies. A representative picture of three independent experiments is shown. The histogram represents the quantification of H3K9me3 levels normalized to global H3 levels (H3K9me3/H3). Results were obtained from three independent biological replicates. *p < 0.05, **p < 0.01. (B) Western blot analysis showing that hyperactive Flag-Sirt1 K230R mutant binds endogenous Suv39h1 with high affinity while the Flag-Sirt1 K230Q mutant binds only weakly. Flag-tagged proteins were isolated from the HEK293T cells 48 h after transfection and analyzed by western blot with the indicated antibodies (upper panel). Inputs are shown in the lower panel. A representative picture of three independent experiments is shown. (C) ChIP analysis of H3K9me3 and total histone 3 (H3) at Sat2 elements indicates increased Suv39h1 activity after stable knockdown of Sirt7, which is then counteracted by the additional knockdown of Sirt1 in U2OS cell lines (left side). No significant changes in global H3 levels are apparent. The graph represents the average of 6 independent ChIP experiments for H3K9me3 and 3 independent experiments for total H3. For each ChIP experiment the qPCR reaction was performed in triplicate. **p < 0.01, NS: not significant. Western blot analysis demonstrated efficient knockdown of Sirt1 and Sirt7 (right side). No significant difference in Suv39h1 expression was observed between the scramble and stable knockdown cells.
Figure 4. Inactivation of Sirt1 in Sirt7 knockout cells abolishes hypermethylation of H3K9. (A) Western blot analysis showing levels of Suv39h1 and H3K9me3 in wildtype (WT) and Sirt7 knockout MEFs (Sirt7 KO) untreated or treated with 10nM of Sirt1 specific inhibitor Ex-527 for 24 h. The quantification of H3K9me3 in relation to global H3 levels is presented in a histogram below. n = 3; *p < 0.05. (B) Schemes depicting the putative mechanisms of Sirt7-mediated regulation of Sirt1. See text for explanation.