Figures & data
Figure 1. Paip2 is detected in the nuclei of S2 cells. (a) Western blot analysis of total protein extract from S2 cells with anti-Paip2 antibodies. The endogenous Paip2 protein is detected as a closely spaced doublet of about 25 kDa. (b) Immunoprecipitation of S2 cell extract (In) with anti-Paip2 and anti-PABP antibodies and preimmune serum (mock). (c) Knockdown of Paip2 in S2 cells led to specific decrease in the intensity of both bands in the doublet detected by Paip2 antibodies. Tubulin was used as loading control. Folds of cell lysate dilution are indicated above the lanes. In control experiment, dsRNA corresponding to the GFP coding sequence was used. (d) Immunostaining of S2 cells (confocal imaging) shows Paip2 localization both in the nucleus and in the cytoplasm. Lamin marks the nuclear envelope. (e) Immunostaining of S2 cells (confocal imaging) shows Paip2 localization versus cytoplasmic localization of translation factor eIF3-S8. (f) Western blot analysis of the lysate of cells expressing FLAG-tagged Paip2 with anti-FLAG and anti-Paip2 antibodies. Note that, unlike with endogenous Paip2, only a single band is observed for the FLAG-tagged Paip2. (g) Immunostaining of S2 cells expressing Paip2-FLAG with FLAG antibodies. Localization of recombinant protein is similar to that of Paip2 detected with Paip2 antibodies in (d).
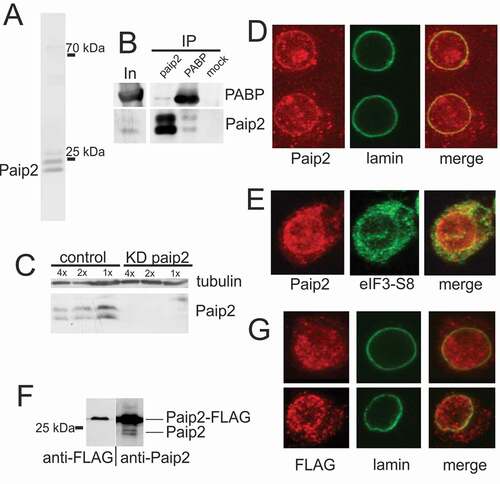
Figure 2. Nuclear Paip2 in Drosophila testis and embryo.(a) Immunostaining of testis with anti-Paip2 (red) and anti-lamin (green) antibodies and counterstaining with DAPI (blue) (confocal imaging), with a merged image shown below: (1) hub and zone of mitotic divisions, (2) zone of primary spermatocytes, (3) zone of meiotic divisions, (4) elongating spermatids (5) seminal vesicle. (b) Immunostaining of the tip of testis (hub and zone of primary spermatocytes) with antibodies against Paip2, FLAG, and lamin (confocal imaging) in wild-type flies (left column) and fly stocks expressing FLAG-Paip2 (central column) and Paip2-FLAG (right column). (c) Immunostaining of an early embryo (stage 3) with antibodies against Paip2 and lamin (confocal imaging). The right column shows images at higher magnification. (d) Immunostaining of the posterior end of an embryo at stage 4–5 (blastoderm) with antibodies against Paip2 and lamin (confocal imaging): SN, somatic nuclei; PGCN, primordial germ cells nuclei.
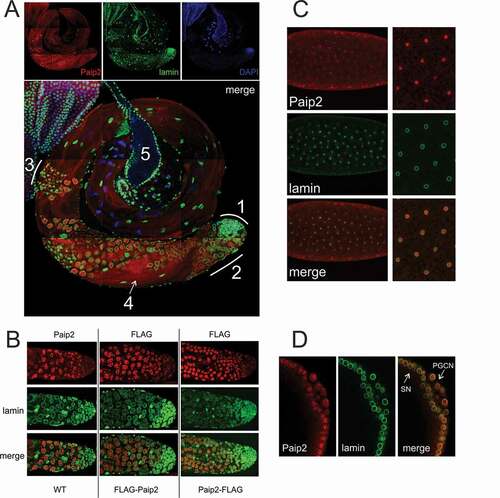
Figure 3. Paip2 is localized to active chromatin.(a) Immunostaining of polytene chromosomes with antibodies against Paip2 and counterstaining with DAPI; a merged image is on the right. Paip2 is detected mainly in DAPI interbands. Loci 46F and 2B are indicated that contain the DHR3 and DHR4 genes, respectively. (b) Scheme of the DHR3 locus and its different transcripts (the ecdysone-inducible RA transcript is highlighted). Roman numerals (I, II, III) indicate three promoters of the gene. Points indicated by Arabic numerals are as follows: (1) RD promoter, (2) RA promoter, (3) 5ʹ-UTR of RA, (4) intron, (5, 6) splice sites, (7, 8) 3ʹ-UTR, (9, 10) polyA signals. (c) ChIP analysis of Paip2 level at different points along the DHR3 gene in untreated cells (grey bars) and cells treated with ecdysone (black bars). The results of ChIP are shown as the percentage of input; S, which corresponds to intergenic spacer which is not transcribed. (d) ChIP analysis of Paip2 level along the DHR4 gene in untreated cells (grey bars) and cells treated with ecdysone (black bars). The structure of the inducible RK transcript is shown. The promoter (point 1) and distal region (point 2) were taken for analysis. (e) Immunostaining of puffs 87A and 87B on polytene chromosomes induced by heat shock. Images show localization of Paip2, DAPI, Paip2 + DAPI (merged), and Pol II. (f) ChIP analysis of Paip2 levels at different sites in the hsp70 transcription. Cells grown at 25°C (grey bars) and heat-shocked cells (black bars) were used for analysis. A scheme of the hsp70 gene is given below, with numerals indicating the locations of primers for ChIP in (1) the promoter, (2) transcribed region, and (3) polyA signal.
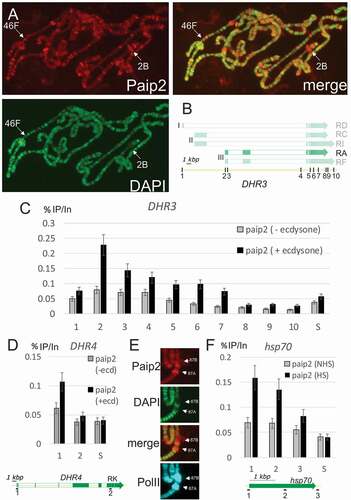
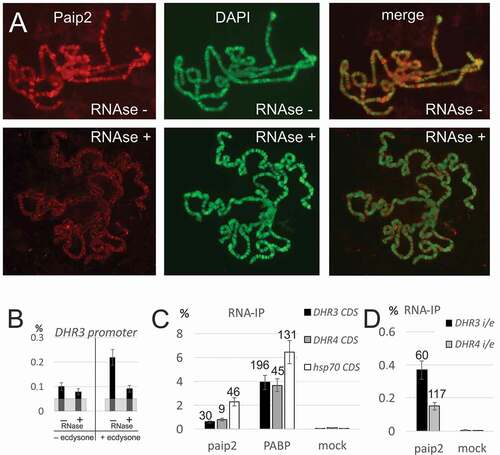
Figure 4. Paip2 is associated with RNA in the nucleus.(a) Immunostaining of polytene chromosomes with antibodies against Paip2 and DAPI counterstaining without and after RNase treatment. (b) ChIP analysis of Paip2 levels in the DHR3 promoter region before and after induction by ecdysone and without and with RNase treatment. Designations are as in . (c, d) RNA immunoprecipitation (RIP) from lysate of S2 cells with antibodies against Paip2 and PABP and with empty beads (mock). The cells were either treated with ecdysone (DHR3 and DHR4 transcripts) or heat shock (hsp70 transcript). Primers for detecting transcripts were located in one exon within the coding region of the corresponding gene (C) or on both sides of the intron/exon boundary of the gene in order to detect nascent transcripts (D). RIP signals are given as percentage of input, enrichment of RNA relative to corresponding mock is indicated above the bars.