Figures & data
Figure 1. Human CIZ1 and variant CIZ1-F.
(A) Exonic sequence in messenger RNA of full-length and CIZ1-F, with location of primers (pri) and Taqman probes indicated. Sequences are provided in Supplementary Table 2. Lines indicate the location of sequences that encode the protein domains illustrated in (B). Four alternative exon 1s are indicated; CIZ1-F has been detected in combination with exons 1b, 1c, and 1d. (B) Full-length and CIZ1-F protein showing annotated protein domains including glutamine-rich regions (Q), nuclear localization signals (NLS), zinc finger domains (ZF), matrin-3 domain (MH3), and acidic domain (AcD). Characterized functional domains and interaction sites for full-length CIZ1 are also shown, including replication domain (RD) which contains all sequences required for replication activity [Citation6], and anchor domain (AD) which contains sequences that are sufficient to mediate attachment to the nuclear matrix [Citation8]. The CIZ1-F specific sequence, encoded by an alternative reading frame (ARF) of exon 12–13, is highlighted in light blue. Also shown are the location of K/RXL cyclin-binding motifs implicated in replication [Citation7] (‘C’), LXXLL ER-interaction motifs (asterisks), and sequences reported for full-length CIZ1 to interact with CDC6 [Citation18], cyclin-dependent kinase 2 (CDK2) [Citation15], cyclins A and E [Citation7], dynein light chain (DYNLL1) [Citation15], estrogen-receptor (ER) [Citation12], enhancer of rudimentary homolog (ERH) [Citation42], p21 [Citation16], and YAP [Citation17]. Note that several of these interactions were discovered in mouse CIZ1, and that the reported interaction between ER and CIZ1 is not via a domain that includes LXXLL [Citation12]. X-axis shows amino acid number. (C) Amino acid sequence of the CIZ1-F protein, with the sequence specified by its ARF bold and underlined. The peptides in red and purple were used to generate CIZ1-F-specific antibodies.
![Figure 1. Human CIZ1 and variant CIZ1-F.(A) Exonic sequence in messenger RNA of full-length and CIZ1-F, with location of primers (pri) and Taqman probes indicated. Sequences are provided in Supplementary Table 2. Lines indicate the location of sequences that encode the protein domains illustrated in (B). Four alternative exon 1s are indicated; CIZ1-F has been detected in combination with exons 1b, 1c, and 1d. (B) Full-length and CIZ1-F protein showing annotated protein domains including glutamine-rich regions (Q), nuclear localization signals (NLS), zinc finger domains (ZF), matrin-3 domain (MH3), and acidic domain (AcD). Characterized functional domains and interaction sites for full-length CIZ1 are also shown, including replication domain (RD) which contains all sequences required for replication activity [Citation6], and anchor domain (AD) which contains sequences that are sufficient to mediate attachment to the nuclear matrix [Citation8]. The CIZ1-F specific sequence, encoded by an alternative reading frame (ARF) of exon 12–13, is highlighted in light blue. Also shown are the location of K/RXL cyclin-binding motifs implicated in replication [Citation7] (‘C’), LXXLL ER-interaction motifs (asterisks), and sequences reported for full-length CIZ1 to interact with CDC6 [Citation18], cyclin-dependent kinase 2 (CDK2) [Citation15], cyclins A and E [Citation7], dynein light chain (DYNLL1) [Citation15], estrogen-receptor (ER) [Citation12], enhancer of rudimentary homolog (ERH) [Citation42], p21 [Citation16], and YAP [Citation17]. Note that several of these interactions were discovered in mouse CIZ1, and that the reported interaction between ER and CIZ1 is not via a domain that includes LXXLL [Citation12]. X-axis shows amino acid number. (C) Amino acid sequence of the CIZ1-F protein, with the sequence specified by its ARF bold and underlined. The peptides in red and purple were used to generate CIZ1-F-specific antibodies.](/cms/asset/9fdd18d7-e69e-41f2-a592-481042d98123/kccy_a_1526600_f0001_oc.jpg)
Figure 2. Nuclear CIZ1-F resists extraction of chromatin but not RNA.
(A-B) CIZ1-F does not localize to the inactive X chromosome (Xi). Immunofluorescence with a monoclonal antibody for a peptide located in the CIZ1 anchor domain (AD; green) shows both diffuse nuclear expression and specific localization to a region previously shown to be the Xi [Citation9]. Immunofluorescence with purified antibody raised to the CIZ1-F ARF (red) shows absence of Xi-localization. DNA is stained with Hoechst33258 (blue). Nuclei in white boxes are enlarged in (B). (C) Overview of nuclear matrix (NM) extraction procedure. MCF-7 cells were serially extracted with 1) detergent-containing cytoskeletal buffer (CSK), 2) detergent-containing CSK supplemented with 0.5 M NaCl (mock extraction), 3) DNase 1, or 4) RNase, or 5) both enzymes (see methods). (D) MCF-7 cells subjected to the treatments described under (C) were counterstained with Hoechst33258 to control for removal of chromatin (blue), and probed with purified polyclonal anti-CIZ1-F or replication domain (CIZ1-RD) antibody 1794 (red). CIZ1-RD resists all treatments, while CIZ1-F is sensitive to extraction of RNA, and is also dramatically revealed by removal of chromatin. Bar is 10 microns. (E) Quantification of the fluorescence intensities in (D), shown after subtraction of background signal and expressed relative to detergent treated cells. Number of cells quantified ≥ 70 per condition. Numbers refer to the treatment conditions listed above. (F) Enhanced and enlarged images of the indicated nuclei i-iv from (D), showing detergent and DNase-resistant nuclear fractions. (G) Interpretation of the data showing the dependency of CIZ1-F on RNA for nuclear retention, compared to full resistance of CIZ1-RD.
![Figure 2. Nuclear CIZ1-F resists extraction of chromatin but not RNA.(A-B) CIZ1-F does not localize to the inactive X chromosome (Xi). Immunofluorescence with a monoclonal antibody for a peptide located in the CIZ1 anchor domain (AD; green) shows both diffuse nuclear expression and specific localization to a region previously shown to be the Xi [Citation9]. Immunofluorescence with purified antibody raised to the CIZ1-F ARF (red) shows absence of Xi-localization. DNA is stained with Hoechst33258 (blue). Nuclei in white boxes are enlarged in (B). (C) Overview of nuclear matrix (NM) extraction procedure. MCF-7 cells were serially extracted with 1) detergent-containing cytoskeletal buffer (CSK), 2) detergent-containing CSK supplemented with 0.5 M NaCl (mock extraction), 3) DNase 1, or 4) RNase, or 5) both enzymes (see methods). (D) MCF-7 cells subjected to the treatments described under (C) were counterstained with Hoechst33258 to control for removal of chromatin (blue), and probed with purified polyclonal anti-CIZ1-F or replication domain (CIZ1-RD) antibody 1794 (red). CIZ1-RD resists all treatments, while CIZ1-F is sensitive to extraction of RNA, and is also dramatically revealed by removal of chromatin. Bar is 10 microns. (E) Quantification of the fluorescence intensities in (D), shown after subtraction of background signal and expressed relative to detergent treated cells. Number of cells quantified ≥ 70 per condition. Numbers refer to the treatment conditions listed above. (F) Enhanced and enlarged images of the indicated nuclei i-iv from (D), showing detergent and DNase-resistant nuclear fractions. (G) Interpretation of the data showing the dependency of CIZ1-F on RNA for nuclear retention, compared to full resistance of CIZ1-RD.](/cms/asset/eeee3c41-cc9e-44b5-9410-cbb42c73c6eb/kccy_a_1526600_f0002_oc.jpg)
Figure 3. CIZ1-F transcript is suppressed and CIZ1-F protein is excluded from the nuclear matrix in quiescent cells.
(A) Immunodetection of CIZ1-F in cycling (day 2), confluent (day 4) and quiescent (day 7 with medium change) populations of MCF-7 cells, after washing with detergent-cytoskeletal buffer to remove soluble protein. Enlarged images of example cells are shown and DAPI-stained images (left) show cell nuclei in the same fields. Bar is 10 microns. (B) Quantification of the average immunofluorescence signal of cells depicted in (A) after subtraction of background. Abbreviations: Cycl, cycling; Confl, confluent; Qsct, quiescent. (C) NM-extraction of quiescent MCF-7 cell populations showing no CIZ1-F on the NM after treatment with DNase. For details on the method see ). (D) Transcript levels in MCF-7 breast epithelial carcinoma cells at the indicated number of days post-plating, measured by quantitative RT-PCR (qPCR). A parallel culture that received regular changes of media (indicated as ‘MC’), harvested at 11 d, is shown for comparison. Histograms show the mean of three technical replicates ± SEM of a representative experiment (experiments were repeated at least 3 times). Data is expressed as relative quantification (RQ) after normalization to ACTB and CYPA, and is calibrated to levels at day 2. Cell counts at the time of harvesting are provided ± SEM (black dotted line; average of three counts expressed as proportion of a confluent population). Right, comparison between replication domain (CIZ1-RD), anchor domain (CIZ1-AD) and CIZ1-F in MCF-7 cells at day 2 ± SEM, with no normalization to show relative levels. (E) As in (D) for MRC5 normal fetal lung fibroblast cells. Right, comparison between CIZ1-RD, CIZ1-AD and CIZ1-F at day 2. SEM for three technical replicates is shown. Primer and probe sequences are in Supplementary Table 2.
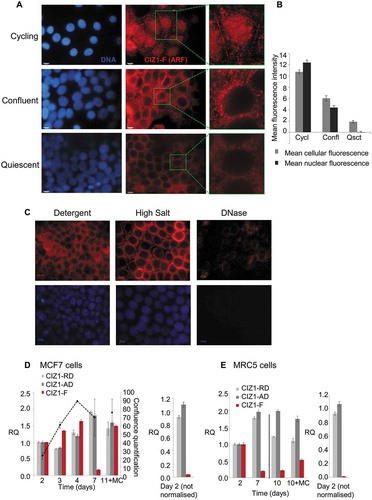
Figure 4. CIZ1-F transcript is expressed in G1-phase.
(a) Quantitative RT-PCR showing CIZ1-F transcript (red) in MCF-7 cells during the first cell cycle following release from contact-inhibition and serum-deprivation induced cell cycle arrest, relative to ACTB and CYPA housekeeping genes, and calibrated to unreleased cells. CIZ1 anchor domain (CIZ1-AD) and replication domain (CIZ1-RD) expression (gray lines), as well as cyclin E1 (blue) are shown for comparison. Data show means of four experiments ± SD. The percentage of cells that incorporated EdU into newly synthesized DNA during a 30 min pulse at the indicated times is shown for comparison (black line; two biological repeats ± SD). Note that error bars for cyclin E1 are very small (range, 0.00001–0.008). Cell cycle stages (estimates based on EdU-incorporation and cyclin-expression) are indicated below. Images on the right show EdU (purple) and total DNA (blue) before (0 h) and after (20 h) release. Bar is 10 microns. (b) CIZ1-AD, CIZ1-RD and CIZ1-F transcript in MCF-7 cells 31 h post-release from quiescence, in the presence and absence of aphidicolin (Aph), nocodazole (Noc) and thymidine (Thy), showing mean of three biological replicates ± SEM. (c) As in (b), but for MRC5 normal lung fetal fibroblast cells. Mean RQ of three technical replicates is expressed relative to cycling samples (± SEM). (d) As in (a), but showing release of MCF-7 cells from a 24 h nocodazole-arrest applied 16 h after release from quiescence. Synchronization strategy is indicated above the graph. Graph shows transcript levels (mean of three technical replicates ± SEM), at the indicated hours after release from arrest, with cell cycle stage (based on cyclin E expression) illustrated below. Right, control sample without nocodazole (40 h post-release from quiescence). (e) Schematic summarizing CIZ1-RD, CIZ1-AD and CIZ1-F mRNA expression levels during the first cell cycle following release from cell cycle arrest (Q-G1) and mitotic arrest (M-G1). Primer and probe sequences are in Supplementary Table 2.
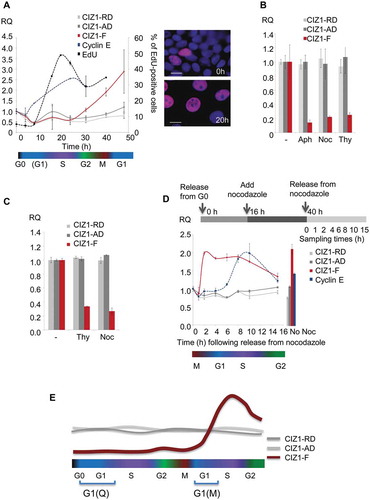
Figure 5. CIZ1-F is overexpressed in early stage human breast and colon cancer.
(a) CIZ1-F and replication domain (CIZ1-RD) expression in 24 primary colon tumors and matched normal samples (Origene colon cancer cDNA array HCRT103), showing mean mRNA expression levels for the average of all matched normal tissues and the four cancer stage classifications. CIZ1-RD and MKI67 are shown for comparison. Individual data per case can be found in , and individual classifications and pathology notes accesses at www.origene.com. (b) As in (a), showing 5 normal samples and 43 primary breast cancer samples from the indicated stages (Origene breast cancer cDNA array BCRT102). Data for individual cases can be found in . (c) As in (a) for the same 24 colon cancer samples and matched normal samples, showing mean mRNA expression grouped by grade. Grade 1: 50% late stage; grade 2: 38% late stage; grade 3: 100% late stage (1 case, white bar). Late stage refers to stage III and stage IV. (d) As in (b) for the same 5 normal samples and 43 primary breast cancer samples, showing mean mRNA expression grouped by grade. Grade 1: 100% late stage tumors; grade 2: 43% late stage tumors; grade 3: 27% late stage tumors. Late stage refers to stage III and stage IV. Mean RQ’s to the mean CIZ1-RD-expression of normal samples ± SEM are shown. Significant differences are indicated (NS, not significant). Primer and probe sequences are in Supplementary Table 2.
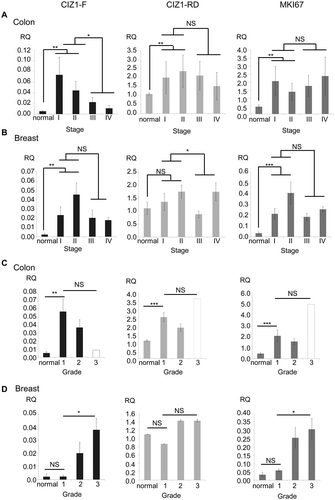
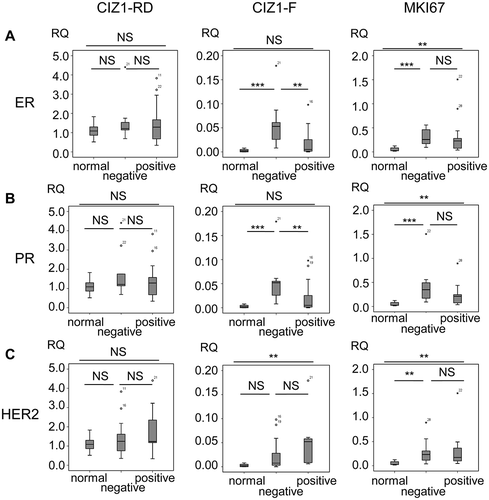
Figure 6. CIZ1-F expression is increased in ER-negative tumors.
Box-plots showing CIZ1 replication domain (CIZ1-RD; left), CIZ1-F (middle) and MKI67 (right) expression in (a) normal samples and estrogen receptor (ER)-positive and -negative tumors, (b) normal samples and progesterone receptor (PR)-positive and -negative tumors, and (c) normal samples and HER-2-positive and -negative tumors. RQ’s are expressed relative to mean CIZ1-RD-expression of normal samples. Significant differences between subgroups are indicated (Mann Whitney U-tests; NS, not significant). Primer and probe sequences are in Supplementary Table 2.