Figures & data
Figure 1. EXO1 gene copy number is increased in HCC as assessed by data-mining of the Oncomine database. Box-whiskers Plot of EXO1 gene copy number between normal and cancer tissue samples in (a) TCGA Liver, (b) Guichard Liver, and (c) Guichard Liver 2 data sets. B, blood; N, normal liver; T, HCC. Numbers below the horizontal axis indicate total cases in different groups. The line within each box represents the median value; lower and upper edges of each box represent the 25th and 75th percentiles, respectively; lower and upper whiskers represent 5th and 95th percentiles, respectively. P values were calculated by the Oncomine database.
Figure 2. EXO1 mRNA expression levels in HCC and paired adjacent non-tumorous liver tissues. (a) Semi-quantitative RT-PCR data for EXO1 in 20 liver cancer cases and paired normal tissues. (b) EXO1 mRNA levels in 143 paired HCC and adjacent non-tumorous liver tissues measured by the QuantiGene Plex assay. Statistical significance was determined by paired two-tailed Student’s t test. ****, P < 0.0001. Lines from the top represent the 75th, 50th, and 25th of EXO1 mRNA values, respectively. N, normal liver; T, HCC.
Table 1. Analyses of the EXO1 gene in 143 HCC tissues.
Figure 3. Prognostic value of EXO1 mRNA expression in HCC. (a) Distribution of EXO1 mRNA and serum AFP expression levels in 143 HCC patients. The numbers on the pie chart represent the percentages of various groups. EXO1 high, EXO1 mRNA levels ≥ 0.075 in HCC specimens; EXO1 low, EXO1 mRNA levels < 0.075 in HCC specimens; AFP high, AFP protein levels ≥ 200μg/l in peripheral blood; AFP low, AFP protein levels < 200μg/l in peripheral blood. (B to G) Kaplan-Meier analyses of EXO1 mRNA expression levels in 143 HCC patients (b), cases with serum AFP ≤ 20µg/L(c), patients with age ≤ 55 years (d), cases with single tumor (e), patients with no lymph node metastasis (f) and Edmonson stage I cases (G). High EXO1 expression was significantly correlated with poor prognosis (P < 0.05).
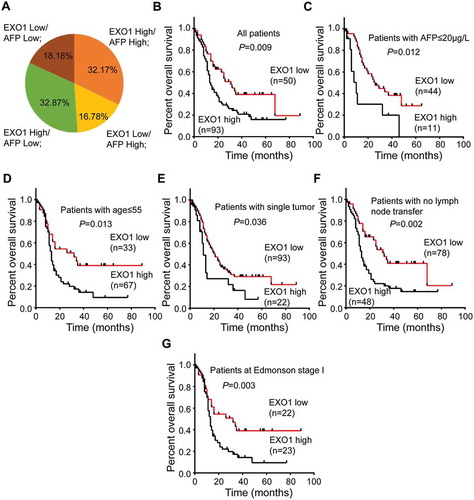
Table 2. Univariate and multivariate Cox regression analyses of EXO1 mRNA expression and clinical variables for overall survival in HCC patients.
Figure 4. EXO1 knockdown descreases the cell proliferation in HCC cells. (a) Cell growth curves of BEL-7404 and YY-8103. EXO1 proteins were detected by western blots. (b) Colony formation of BEL-7404 and YY-8103. All experiments were performed in triplicates and data are shown as mean ± SD. Statistical significance was determined by two-tailed Student’s t test. *, P < 0.05; **, P < 0.01.
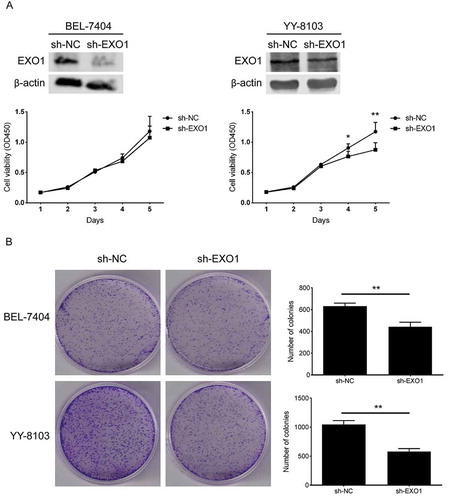
Figure 5. EXO1 silencing dysregulates the cell cycle in HCC cells. (a) Cell cycle analysis by DNA content measured flow-cytometrically. (b) Cell cycle analysis 24h after ionizing radiation (4Gy). Cell cycle models were fit by the ModFit LT software (left). Average percentages of G0/G1, S and G2/M phase cells are shown on the right. All experiments were performed in triplicate, and data are mean± SD. Statistical significance was determined by two-tailed Student’s t test. *, P < 0.05; **, P < 0.01; ***, P < 0.001; ****, P < 0.0001.
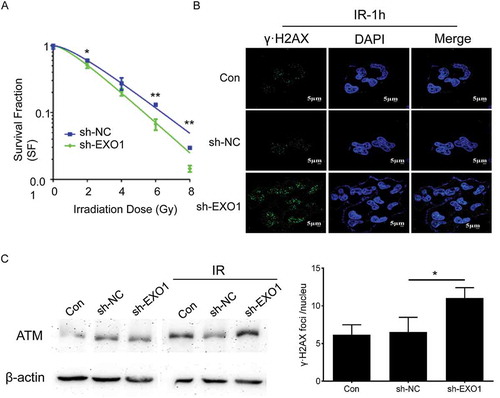
Figure 6. EXO1 knockdown regulates the clonogenic survival, γ-H2AX locus formation and ATM accumulation in YY-8103 cells. (a) Clonogenic survival fractions of cells irradiated with a single dose of 0, 2, 4, 6 and 8 Gy X-rays. Survival curves were obtained by means of 3 standard colony formation assay. (b) γ-H2AX loci of cells irradiated with a single dose of 2 Gy. Quantitative analysis of γ-H2AX foci per cell averaged over 50 cells per data point. (c) ATM accumulation of cells irradiated with a single dose of 2 Gy revealed by western blots. Statistical significance was determined by two-tailed Student’s t test. *, P < 0.05; **, P < 0.01.