Figures & data
Figure 1. Cell cycle dynamics in siCtrl and siBmal1 cells. (a) Representative example of time series images of the nucleus of a proliferating siCtrl (NIH3T33C) cell, stably expressing circadian clock (Rev-Erbα-VNP; yellow), as well as G1 (hCdt1-mKOrange; red) and S/G2/M (hGeminin-CFP; blue) cell cycle markers. Shown are pictures at 1.5 hour time intervals over a 18 h period, spanning one cell cycle. (b) Circadian clock performance and cell cycle progression in a siCtrl (left panel) and a siBmal1 cell (right panel). Plotted are fluorescence intensities of each of the markers over a 48 hour period. The G1 phase is defined as the interval between the peaks of hGeminin-CFP and hCDT1-mKOrange expression. Oppositely, the S/G2/M phase is defined as the interval between the peaks of hCDT1-mKOrange and hGeminin-CFP expression. (c) Box plot showing the cell cycle period and G1 and S/G2/M cell cycle phase length in siCtrl and siBmal1 cells (n = 50 cells per condition). Lowest and highest boundaries of the box indicate the 25th and 75th percentiles, respectively. The whiskers above and below the box designate the 95th and 5th percentiles, respectively. The solid line and cross within the box represent the median and mean value, respectively. *** p < 0.001 (Mann Whitney U test).
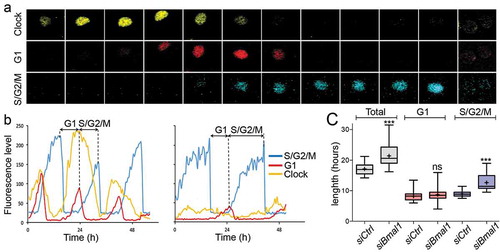
Figure 2. Cell cycle phase distribution of siCtrl and siBmal1 cells. (a) Flow cytometric analysis of cell cycle phases in siCtrl and siBmal1 cells. Shown are representative examples of propidium iodide (PI) stained siCtrl and siBmal1 cells, analysed for DNA content (n = 3 experiments). The vertical axis indicates the relative number of cells and the horizontal axis indicates the relative PI fluorescence. The 2N and 4N peaks and intermediate region correspond to G1, G2/M and S phase, respectively. (b) Quantification of cell cycle phase distribution of proliferating siCtrl and siBmal1 cells. Shown are the average cell numbers of the 3 independent experiments (each performed in triplicate; 20,000 cell counts per triplicate). The data were compared using the two-tailed unpaired Student’s t-test. Error bars indicate SE. ** p < 0.01. (c) Flow cytometry analysis of the number of mitotic cells. The bivariate dot plots show DNA content (PI) and mitotic phosphoproteins content (MPM2 stain) on the X and Y axis, respectively. The box marks cells stained positive for MPM2. (d) Western blot analysis of whole cell extracts from proliferating siCtrl and siBmal1 cells for Cyclin D1, Cyclin E, Cyclin A, and Cyclin B1 proteins. Shown are representative examples of n = 3 independent experiments. Actin was used as a loading control. (e) Average cyclin protein levels in proliferating siCtrl and siBmal1 cells (n = 3 independent experiments). Cyclin expression levels were normalized against actin. Cyclin expression levels in control cells were set as 1. Error bars indicate SD (n = 3 experiments).
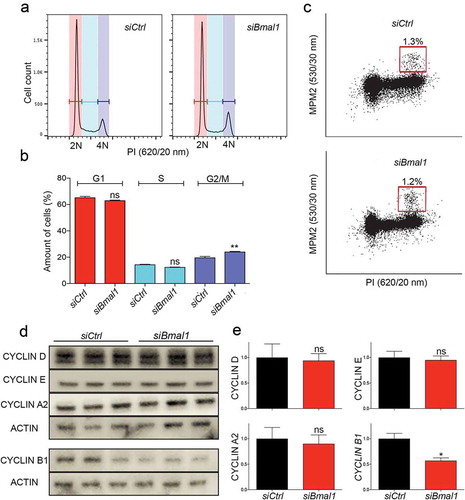
Figure 3. Cell cycle protein expression in siCtrl and siBmal1 cells. (a) Cytochemical analysis of DNA synthesis in cell cycle synchronized siCtrl and siBmal1 cells after release from a 24 h thymidine block. Cells were harvested at 1 h intervals. Prior to harvesting, cells were exposed to a 1 h pulse labelling with EdU. (b) S phase kinetics. Quantification of Edu incorporation by siCtrl and Bmal1 cells during the 1 h pulse labelling interval, preceding cell harvesting. The Y axis indicates the mean fluorescence intensity, corrected for the number of cells. The X axis indicates time of harvesting after thymidine release. Error bars indicate SD (n = 3 experiments). The grey bar indicates the estimated time of S/G2 transition. (c, f and h) Western blot analysis of Cyclin E and Cyclin A2 (c), Cyclin B1 (f) and WEE1 (h) protein levels in siCtrl and siBmal1 cells after release from a thymidine block. Shown are representative examples of n = 3 independent experiments. Actin was used as a loading control. (d,e,g and i) Kinetics of Cyclin E (d), Cyclin A2 (e), Cyclin B1 (g) and WEE1 (i) expression after release from a thymidine block. Expression levels were normalized against actin. Expression levels in siCtrl cells at t = 0 were set as 1. Error bars indicate SD. The grey bar indicates the estimated time of S/G2 transition.
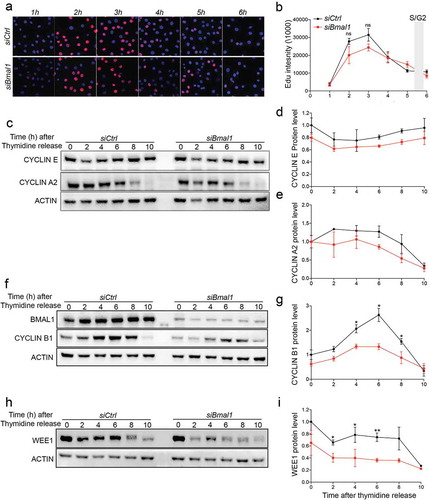
Figure 4. Cell cycle dynamics and Cyclin B1 protein expression in siCtrl and siClock cells. (a) Circadian clock performance and cell cycle progression in a siCtrl (left panel) and a siClock cell (right panel). Plotted are fluorescence intensities of each of the markers over a 60 hour period. (b) Box plot showing the cell cycle period and G1 and S/G2/M cell cycle phase length in siCtrl and siClock cells (n = 40 cells per condition). Lowest and highest boundaries of the box indicate the 25th and 75th percentiles, respectively. The whiskers above and below the box designate the 95th and 5th percentiles, respectively. The solid line and cross within the box represent the median and mean value, respectively. * p < 0.05; *** p < 0.001 (Mann Whitney U test). (c) Flow cytometric analysis of cell cycle phases in siCtrl and siClock cells. Shown are representative examples of propidium iodide (PI) stained siCtrl and siBmal1 cells, analysed for DNA content (n = 3 experiments). The vertical axis indicates the relative number of cells and the horizontal axis indicates the relative PI fluorescence. The 2N and 4N peaks and intermediate region correspond to G1, G2/M and S phase, respectively. (d) Quantification of cell cycle phase distribution of proliferating siCtrl and siClock cells. Shown are the average cell numbers of the 3 independent experiments (each performed in triplicate; 20,000 cell counts per triplicate). The data were compared using the two-tailed unpaired Student’s t-test. Error bars indicate SE. * p < 0.05; ** p < 0.01. (e) Western blot analysis of Cyclin B1 protein levels in siCtrl and siClock cells after release from a thymidine block. Shown are representative examples of n = 3 independent experiments. Actin was used as a loading control. (f) Kinetics of Cyclin B1 expression after release from a thymidine block. Cyclin B1 expression levels were normalized against actin. The Cyclin B expression level in siCtrl cells at t = 0 was set as 1. Error bars indicate SD (n = 3 experiments).
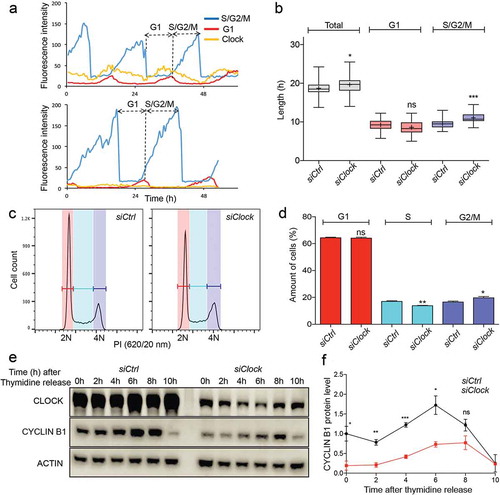
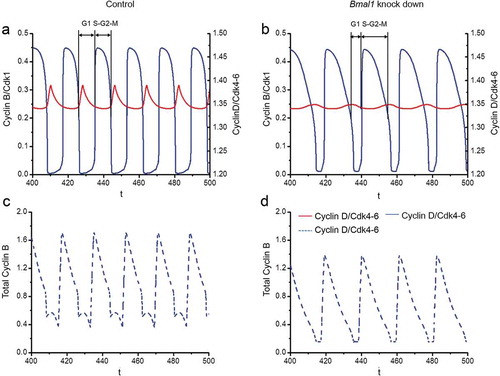
Figure 5. Computational modeling of the impact of Bmal1 knockdown on Cyclin/CDK levels. Analysis of the effect of silencing of Bmal1 expression in the computational model for coupled mammalian circadian clock and cell cycle oscillators. The time series in the upper panels show the evolutions of Bmal1 mRNA (dark cyan, solid line), total BMAL1 protein (dark cyan, dashed line) and Rev-Erbα mRNA (orange) under normal conditions (a) or when the synthesis rate of Bmal1 mRNA is reduced by 70% (b). The period of the circadian clock is 18h in control conditions. However, the oscillations in (b) disappear upon decreasing Bmal1 mRNA synthesis. The time series in the middle panels show the time evolutions of Cyclin A/CDK2 (light green), Cyclin E/CDK2 (mustard green), Cyclin B/CDK1 (blue) and CyclinD/CDK4-6 (red) in control conditions, when the cell cycle is synchronized to the circadian clock (c), or when Bmal1 is knocked down (d). The period of the cell cycle increases from 18h in (c) to 21.1 h in (d). Also, the width of the activity peak of Cyclin B/CDK1 (blue) is significantly increased. The time series in the bottom panels show the evolutions of Cyclin B/CDK1 (blue) and WEE1 (black) when cells are in control conditions (c) or when Bmal1 gene expression is knocked down (d). The concentration of WEE1 decreases in (d) due to the lack of induction Wee1 transcription by BMAL1. Parameter values used for numerical simulations are listed in the SI appendix.
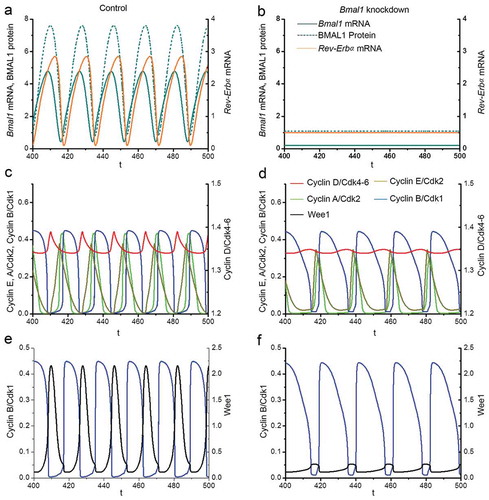
Figure 6. Computational modeling of the impact of Bmal1 knockdown on cell cycle phase length. The time series in the upper panels show the evolutions of Cylin D/CDK4-6 (red) and Cyclin B/CDK1 (blue) when the circadian clock is in control conditions (a) or when Bmal1 expression is reduced by 70% (b). As in the corresponding , the period of the cell cycle increases from 18 h in (a) up to 21.1 h when Bmal1 expression is supressed (b). The black bars indicate the G1 phase (from mid-decrease of Cyclin B/CDK1 to 30%-decrease in Cyclin D/CDK4-6) and S/G2/M phase (from 30%-decrease in Cyclin D/CDK4-6 to mid-decrease of cyclin B/CDK1). The durations of G1 and S/G2/M in (a) are 5.84 h and 12.19 h, respectively. The durations of G1 and S/G2/M in (b) are 6.41 h and 14.74 h, respectively. Thus, the S/G2/M phase contributes most to the prolongation of cell cycle duration upon knocking down BMAL1. The time series in the lower panels show the evolutions of total Cyclin B (dashed blue line) in control conditions (c) or upon suppression of Bmal1 RNA synthesis (d). The total amount of Cyclin B (free + complexed with the kinase CDK1 and its inhibitor p21) decreases when Bmal1 expression is reduced.