Figures & data
Table 1. Representative description of the investigated PSs.
Figure 1. Cytotoxic effect of PSs. Vero cells (2x10⁵) were plated in 24 well plates and treated with different concentrations of the tested PSs. The cell viability was measured 3 days after the treatment. The results are presented as a percentage of the control untreated cells. Data are expressed as the mean ± SEM percentage (n = 5); *p < 0.05; **p < 0.001 vs. control untreated cells.
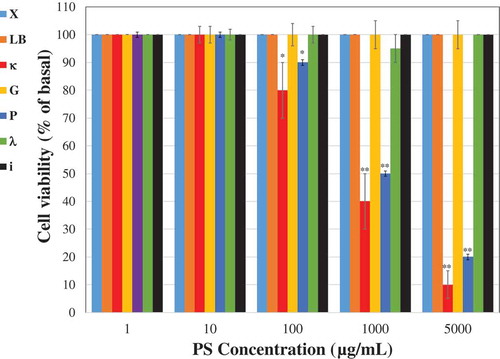
Figure 2. (a) Control untreated Vero cells. (b) Cells after 3 days of treatment with 1000 µg/mL κ.
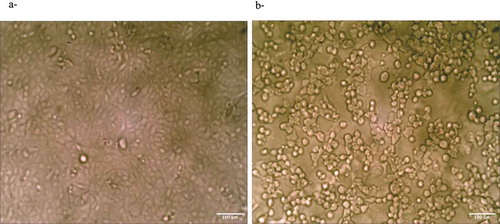
Figure 3. Vero cells were infected with 0.01 m.o.i of VZV in the absence or presence of various doses of the tested PSs. The infected cells were treated with the PS during the infection and 2-days post infection. The effect is presented as inhibition percentage compared to the infected untreated cells. Data are expressed as the mean ± SEM percentage (n = 5); **p < 0.001 vs. the infected untreated cells.
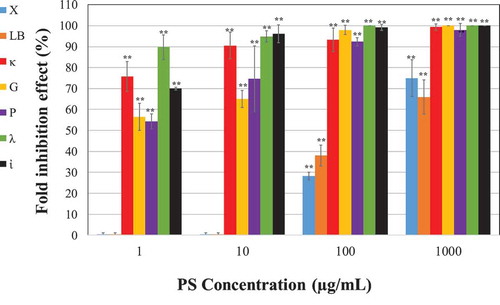
Table 2. CC50, IC50 and SI values of different polysaccharides against VZV.
Figure 4. Antiviral activity of i on VZV infection at different stages of the infection. Vero cells infected with 0.01 m.o.i of VZV and treated with 1 µg/mL of ἰ at different periods of time. Furthermore, direct effect of ἰ on the virus infectivity (direct incubation) and its effect on the endogenous virus production were examined (n = 5); **p < 0.001 vs. the infected untreated cells.