Figures & data
Figure 1. Metabolite content as a normalization factor for cell cycle progression. a) Diagram of metabolite peak numbers. 3,426 peaks were identified from untargeted analysis, 15,49 peaks were annotated from HMDB, and 921 peaks were manually curated. b) DNA histogram of sorted cells. Fraction of sorted G1 and SG2M phase cells is indicated in the plot. c) Illustration of theoretical cell growth during the cell cycle. When the fraction of G1 cells is 0.69, the calculated theoretical size ratio between SG2M vs G1 is 1.37. d) Forward scatter of cells in G1 and SG2M phases as a measure of cell size. The ratio of the median for SG2M vs. G1 is 1.16. e) The correlation of total peak area of 921 metabolites (T921) with the number of injected cells. f) T921 of cells in G1 and SG2M phases, respectively. T921 ratio of SG2M vs. G1 was 1.19, and was used to normalize metabolite data. Error bars denote standard deviation (n = 3)
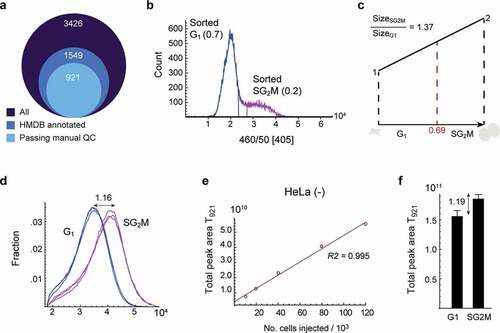
Figure 2. Oscillating and housekeeping metabolites in cycling cells. a) S-plot of metabolite relative abundance ratios in SG2M vs. G1 phase cells. Dashed lines indicate 2-fold change. b) Peak areas of deoxyadenosine triphosphate (datp) and deoxythymine triphosphate (dttp) in G1 (blue) and SG2M (red) cells. (c-g) Relative abundances ratios (SG2M vs. G1) for: c) Deoxyribonucleotide monophosphates, d) Ribonucleotides, e) Amino acids, f) PPP sugars, g) phospholipid subtypes, plotted in order of increasing mean SG2M/G1 ratios. Error bars denote standard deviation (n = 3)
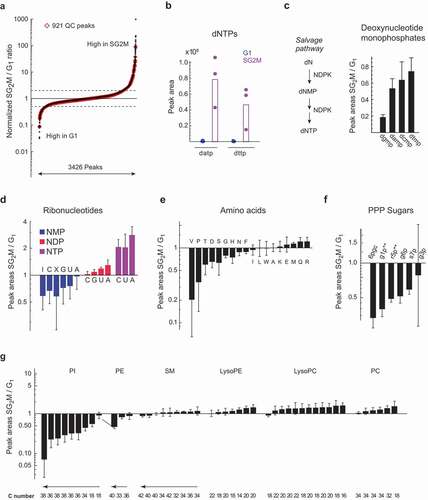
Figure 3. Identification of unknown cycling metabolites. a) Relative abundance of peak 223, annotated as S-Lactoylglutathione. b) Methylglyoxal detoxification reactions where S-Lactoylglutathione is involved. c) Labeling of S-Lactoylglutathione in 13C6-glutamine (HeLa) and 1-13C1-glucose (HCT116) tracing experiments. d) Relative abundance of methylglyoxal and reduced glutathione in sorted samples. Error bars denote standard deviation (n = 3)