
Figures & data
Table 1. The sequence of the oligonucleotides in this work
Figure 1. Expression and activity of PFK1 in nasopharyngeal tissues. (a–b) Western blot of PFK1 in different tissues where β-actin protein was used as reference shows significant difference in PFK1 expression level. (c) Quantification of PFK1 mRNA expression in different nasopharyngeal tissues detected by qPCR. The expression of β-actin protein and mRNA was served as the controls for sample loading. (d) Analysis activity of PFK1 enzyme in different groups. All experiments were performed at least three times with consistent and repeatable results
Figure 2. Construction, identification and expression of PFK-1 shRNA recombinant plasmids. (a) Schematic diagram of the recombinant pYr-1.1-hU6-EGFP vector. (b) RT-PCR analysis identified the PFK-1 shRNA recombinant plasmids after digestion with restriction enzyme XhoI. The level of sh-PFK1-507 mRNA expression was higher compared with other RNA interference fragment. (c) RT-PCR analysis of PFK1 mRNA expression. The β-actin mRNA and protein expression served as controls for sample loading. (d) Immunofluorescence microscopy images (left: bright field, right: green fluorescence EGFP) of intracellular trafficking of different PFK1 in CNE2 cells at optimal ratios
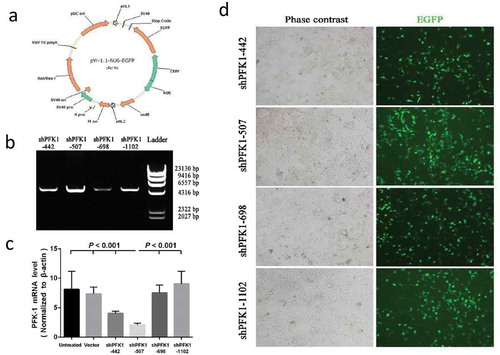
Figure 3. Effects on shRNA-mediated silencing of PFK1 at the mRNA and protein levels. The CNE2 cells were stably transduced with a sh-PFK1-507 plasmid or a control vector. The expression of PFK1 mRNA (a) and protein (b) in stable clones was examined by RT-PCR and Western blot analysis. β-actin served as an internal control. mRNA or Protein quantification was obtained by densitometric analysis of the mRNA (c) or protein (d). (e) Effects of PFK1 knockdown by sh-PFK1-507 on enzyme activity. All experiments were performed at least three times with consistent and repeatable results
Figure 4. Effect of sh-PFK1-507 on apoptosis and proliferation of CNE2 cells. (a) Flow cytometry analysis of cell apoptosis. Cells were incubated in culture medium for 24 h after transfected with sh-PFK1-507. (b) The mean± SD (Standard deviation) percentage of apoptosis cells measured from Flow cytometry. Compared with control cells, the apoptotic rate of sh-PFK1-507 cells significantly increased (39.01 ± 5.08%; p < 0.001). (c) Detection of cell viability via MTT assay. Proliferation of CNE2 cells stably transfected with sh-PFK1-507, vector or untransfected CNE2 cells were evaluated. The highest inhibitory rate of sh-PFK1-507 transfected cells was 33.69 ± 3.47% (p < 0.05). (d–e) Apoptosis proteins (active caspase-3, active caspase-9, and Bax) were increased, and antiapoptosis (Bcl-2 and PCNA) were reduced in CNE2 cells transfected with sh-PFK1-507. All experiments were performed three times with consistent and repeatable results
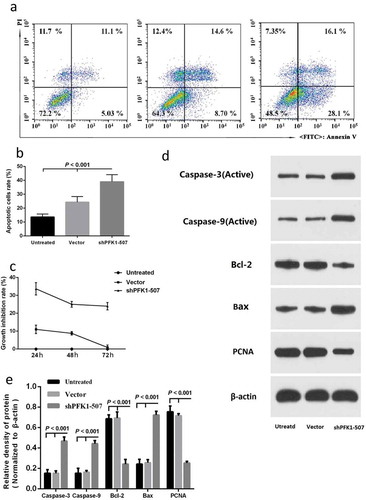
Figure 5. Stable knockdown of PFK1 inhibited migration of CNE2 cells. (a) Migration of CNE2 cells into the scratch wound after 0, 12 and 24 h of culture with ShPFK1-507 in the Wound healing assay. (b) Migration rate of CNE2 after incubation in 12 and 24 h
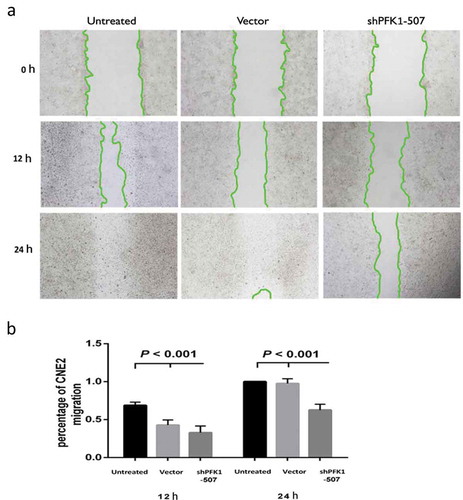
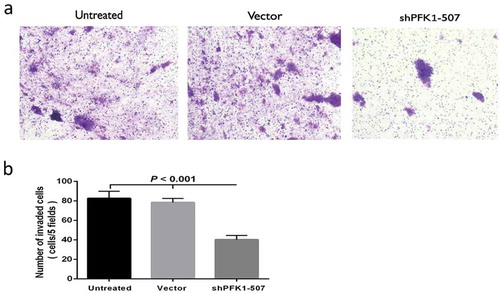
Figure 6. Stable knockdown of PFK1 inhibited invasion of CNE2 cells. (a) Representative cells invade through Matrigel and membrane. (b) Amount of invaded cells in different groups. All experiments were performed at least three times with consistent and repeatable results
Data availability statement
The datasets used and/or analyzed during the current study are available from the corresponding author on reasonable request.