Figures & data
Figure 1. Diameter measurement and classification of PFFs. A. PFFs were divided into three groups based on microscopic assessment. PFFs, porcine fetal fibroblasts; S, small; M, medium; L, large. B. Measurement of cell’s diameter. C. Diameter distribution diagrams and pie graph of PFFs. Green, blue and red represent small cells, medium cells and large cells, respectively. D. Verification of reliability of classification method by ninefold replicate operation. The results are presented as the mean±SD. Data are representative of three independent experiments (a, b, cP<0.05)
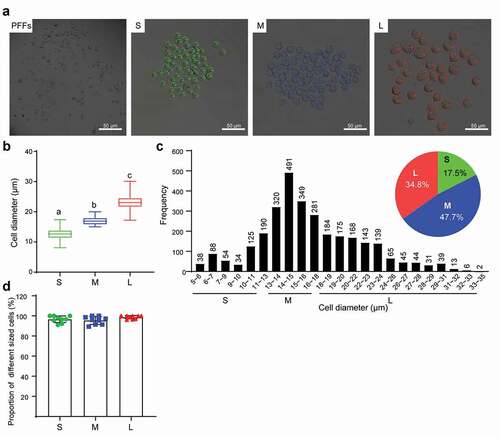
Figure 2. Microscopic assessment of morphological structure of PFFs of different sizes. A. Morphological structure of small (s), medium (m) and large (l) cells as assessed by microscopy (10×). B. Phenotype of vacuoles in small (S), medium (M) and large (L) cells as assessed by microscopy (40×); the red arrow refers to the clear vacuoles. C. Quantitative analysis of vacuoles scattered in different sized PFFs. The results are presented as the mean±SD. Data are representative of three independent experiments (a, b, cP<0.05)
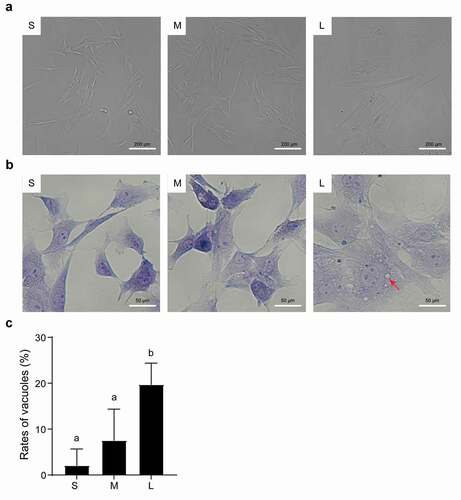
Figure 3. Microscopic assessment of cell membrane morphology of PFFs of different sizes. A. The different degrees of cell membrane roughness of small (s), medium (m) and large (l) cells as assessed by microscopy. B. The cell membrane of small (S), medium (M) and large (L) cells under 10×, 40× and 100× microscopy. The red arrows represent irregular parts of cells
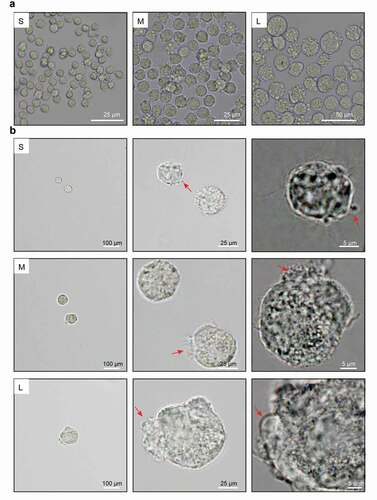
Figure 4. Subcellular structure of different sized PFFs under TEM. A. The subcellular structure of small (s), medium (m) and large (l) cells was observed at 3000×, 10000× and 30000×, which mainly represented the differences in the cell nucleus. N, nucleus; a, autophagosome; al, autolysosome; nm, normal mitochondrion; am, abnormal mitochondrion. B. Quantitative data of abnormal mitochondria in PFFs of different sizes. C. Quantitative data of autophagosomes in PFFs of different sizes. The results are presented as the mean±SD. Data are representative of three independent experiments (a, b, cP<0.05)
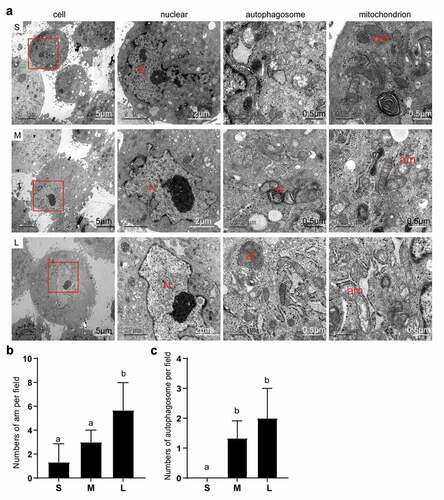
Figure 5. Proliferation capability of different sized PFFs. A. Growth status of single cell colonies from different sized cells after 12 days of culture. Magnification, 4×. B. Growth curve of different sized cells. C. Cellular colony formation rates of PFFs of different sizes. D. Cell cycle of different sized cells. The results are presented as the mean±SD. Data are representative of three independent experiments (a, b, cP<0.05)
Figure 6. Senescence and apoptosis of PFFs of different sizes. A. SA-β-gal-stained PFFs of different sizes. B. The apoptotic rates of different sized PFFs as assessed by flow cytometry. Magnification, 10×. PI and Annexin V staining was used to determine the percentage of live (PI−/Annexin V-FITC−), early apoptotic (PI−/Annexin V-FITC+) and apoptotic or necrotic (PI+/Annexin V-FITC+) cells. C. Quantitative data of senescence in different sized PFFs. D. Quantitative data of apoptosis in PFFs of different sizes. Data are presented as the mean±SD of three independent experiments (a, b, cP<0.05)
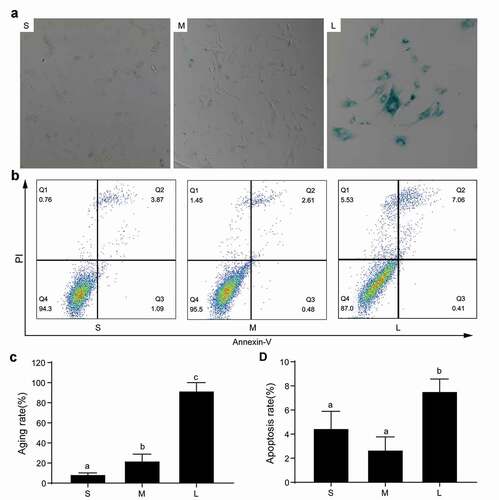
Table 1. Effects of different diameter donor cells on the development of SCNT embryos
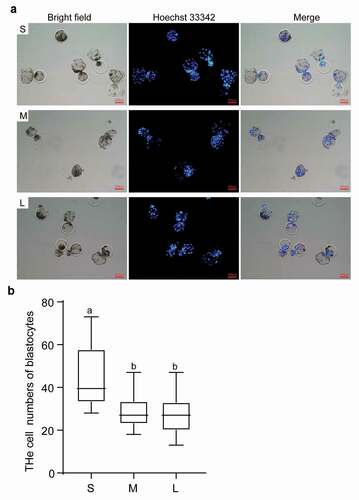
Figure 7. Effects of different sized PFFs on the blastocyst formation. A. The blastocysts derived from different sized PFFs for SCNT. Scale bar = 200 μm. B. The cell numbers of blastocysts. Data are presented as mean±SD of three independent experiments (a, b, cP<0.05)