Figures & data
Figure 1. Effects of DOX on apoptosis in U87 and T98G cells. Cells were incubated with various concentrations of DOX in 10-cm plates for 24 h and harvested for Western blotting. Immunoblot images of p53, p21, Bim, Puma, γH2AX, caspase 3(a) or PARP are shown. GAPDH served as a loading control. Immunoblot images of p53, γH2AX and caspase 3(a) normalized to GAPDH were quantitated as shown (**P < 0.01). The immune blots were cropped from different parts of the same gels and visualized by ECL under various exposure conditions dependent on the activity of antibodies. Representative blots from triplicate experiments are shown. a) DOX-treated U87 cells. b) DOX-treated T98G cells. c) DOX-treated T98G cells.
Figure 2. Effects of DOX on p21 expression and apoptosis in U87-p53DN and U87-EGFP cells, and localization of p53 under DOX treatment. U87-p53DN and U87-EGFP cells were incubated with various concentrations of DOX in 10-cm plates for 24 h and harvested for Western blotting. Immunoblot images of p53, p21 or caspase 3(a) are shown. GAPDH served as a loading control. The immunoblot images of p21 or caspase 3(a) normalized to GAPDH were quantitated as shown. For p53 localization, U87 cells were incubated with various concentrations of DOX in 10-cm plates and harvested for nuclei and cytosol fractionation. The nuclei and cytosol fractions were analyzed by Western blotting. Immunoblot images of p53 and p21 are shown. Lamin A/C and GAPDH served as the specific markers of nuclei and cytosol, respectively. The immunoblot images of p53 and p21 in the nucleus or cytosol were normalized to lamin A/C or GAPDH, respectively, quantitated as shown. The immune blots were cropped from different parts of the same gels and visualized by ECL with various exposure conditions dependent on the activity of antibodies. Representative blots from triplicate experiments are shown. a) and b) DOX-treated U87-p53DN and U87-EGFP cells. c) The nuclei and cytosol fraction for U87 cells under DOX treatment.
Figure 3. Effects of BTZ and SAHA on apoptosis in U87 and T98G cells. Cells were incubated with various concentrations of BTZ or SAHA in 10-cm plates for 24 h and harvested for Western blotting. Immunoblot images of p53, p21, caspase 3(a) or PARP are shown. GAPDH served as a loading control. Immunoblot images of p53, p21, caspase 3(a) or PARP(c) normalized to GAPDH were quantitated as shown (**P < 0.01). The immune blots were cropped from different parts of the same gels and visualized by ECL under various exposure conditions dependent on the activity of antibodies. Representative blots from triplicate experiments are shown. a) BTZ-treated U87 cells. b) BTZ-treated T98G cells. c) SAHA-treated U87 cells. d) SAHA-treated T98G cells.
Figure 4. Effects of the combination of DOX with BTZ on apoptosis in U87 and T98G cells. Cells were incubated with various concentrations of DOX alone or with 0.05 μM of BTZ for 24 h in 10-cm plates harvested for Western blotting. Immunoblot images of p53, caspase 3(a), PARP or PARP (c) are shown. GAPDH served as a loading control. The immunoblot images of p53, caspase 3(a) or PARP(c) normalized to GAPDH were quantitated as shown. For p53 localization, U87 cells were incubated with BTZ, DOX and the combination of DOX with BTZ in 10-cm plates and harvested for nuclei and cytosol fractionation. The nuclei and cytosol fraction were analyzed by Western blotting. Immunoblot image of p53 is shown. Lamin A/C and GAPDH served as specific markers of nuclei and cytosol, respectively. The immunoblot images of p53 in the nucleus or cytosol were normalized to lamin A/C or GAPDH, respectively, and quantitated as shown. The immune blots were cropped from different parts of the same gels and visualized by ECL under various exposure conditions dependent on the activity of antibodies. Representative blots from triplicate experiments are shown. a) U87 cells treated by the combination of DOX with BTZ. b) T98G cells treated by the combination of DOX with BTZ. c) The nuclei and cytosol fraction for U87 cells treated by the combination of DOX with BTZ.
Figure 5. Effects of the combination of DOX with SAHA or of BTZ with SAHA on apoptosis in U87 and T98G cells. For the combination of DOX with SAHA, U87 cells were incubated with various concentrations of DOX alone or with 1 μM of SAHA in 10-cm plates for 24 h and harvested for Western blotting. Immunoblot images of caspase 3(a) and PARP(c) are shown. GAPDH served as a loading control. The immunoblot images of caspase 3(a) normalized to GAPDH was quantitated as shown. For the combination of BTZ with SAHA, U87 or T98G cells were incubated with various concentrations of BTZ alone or with 1 μM of SAHA in 10-cm plates for 24 h and harvested for Western blotting. Immunoblot images of caspase 3(a) or PARP(c) are shown. GAPDH served as a loading control. The immunoblot images of caspase 3(a) or PARP(c) normalized to GAPDH were quantitated as shown. The immune blots were cropped from different parts of the same gels and visualized by ECL under various exposure conditions dependent on the activity of antibodies. Representative blots from triplicate experiments are shown. a) U87 cells treated by the combination of DOX with SAHA. b) U87 cells treated by the combination of BTZ with SAHA. c) T98G cells treated by the combination of BTZ with SAHA.
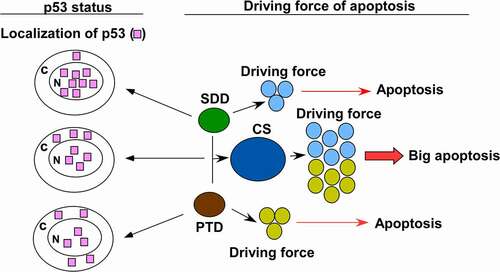
Figure 6. Schematic representation of p53 status and apoptosis in response to SDD, PTD and CS.