
Figures & data
Figure 1. Identification of circHGS. (a) Five upregulated circRnas were screened from the GEO database (GSE97239) in circRNA expression profiles of three pairs of BCa tissues and paired adjacent normal bladder tissues. (b) the expression of circHGS in 30 BCa tissues and paired normal tissues. (c) the expression of circHGS was elevated in BCa cells compared with SV-HUC-1 cell. (d) CircHGS is generated by back-splicing of exons 10, 11 and 12 of HGS. (e) qRT – PCR was performed to measure relative circHGS and HGS mRNA levels at 4 different time points in BCa cells treated with actinomycin D. (f) qRT – PCR was used to detect the expression of circHGS in the cytoplasm and nucleus of BCa cells; GAPDH and U6 were used as internal references. (g) FISH experiments were conducted to confirm the subcellular localization of circHGS in T24 and UM-UC-3 cells, and nuclei were stained with Hoechst 33,342. Data are shown as the means ± SD of three independent experiments, * P < 0.05, **P < 0.01.
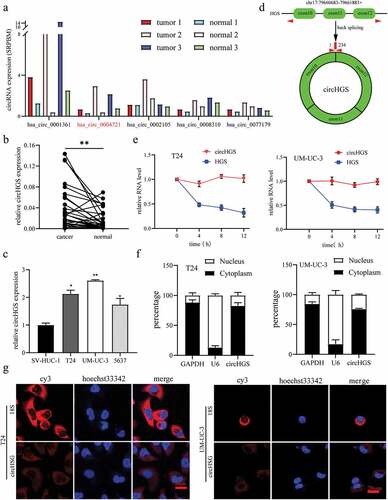
Table 1. Relationship between circHGS expression and clinical characteristics in BCa patients.
Figure 2. The effects of circHGS on BCa cell proliferation and cell cycle. (a–c) the proliferation ability of T24 cells treated with siRNA targeting circHGS or circHGS overexpression plasmid was measured by CCK8 assays and colony formation assays. (d–g) Cell cycle progression was detected by flow cytometry assay in T24 cells treated with siRNA targeting circHGS or circHGS overexpression plasmid. (h-k) Western blot assays were performed to detect the expression of Cyclin D1, CDK6 and CDK4 in BCa cells.
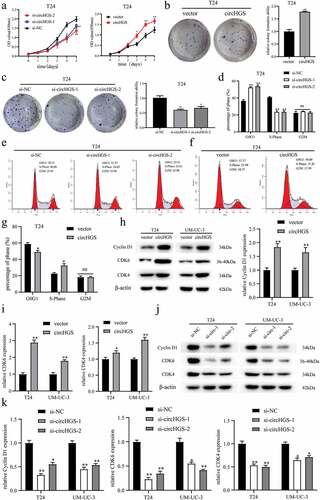
Figure 3. CircHGS enhances the migration and invasion abilities of BCa cells. (a-c) the migration and invasion abilities of BCa cells transfected with siRNA targeting circHGS were detected by Transwell assay. (d-e) Wound-healing assays were applied to detect the migration ability of BCa cells treated with siRNA targeting circHGS. (f-g) the migration and invasion abilities of BCa cells transfected with circHGS overexpression plasmid were detected by Transwell assay. (h-j) Wound-healing assays were applied to detect the migration ability of BCa cells treated with circHGS overexpression plasmid. Data are shown as the means ± SD of three independent experiments, * P < 0.05, **P < 0.01, ***P < 0.001.
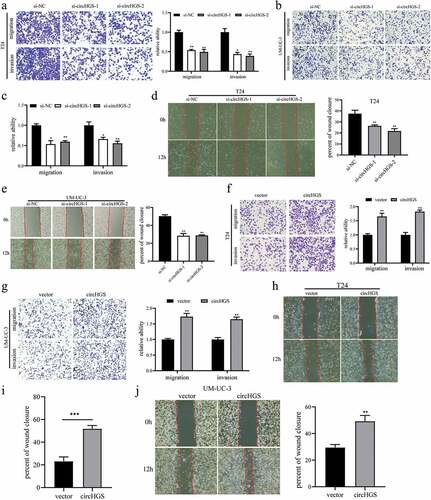
Figure 4. CircHGS served as a sponge for miR-513a-5p. (a) RNAhybrid, miRanda and CircInteractome databases were used to predict potential miRnas that could bind to circHGS. (b) Three potential miRnas were predicted by bioinformatics. (c) the binding sites of circHGS and miR-513a-5p, miR-1184, or miR-1205. (d) Dual-luciferase reporter gene assays were conducted to determine the interactions between circHGS and miR-513a-5p, miR-1184 or miR-1205 in T24 and UM-UC-3 cells. (e) the binding sites between circHGS-wt and miR-513a-5p. (f) Dual-luciferase reporter gene assays were used to detect the interactions between miR-513a-5p and circHGS-wt or circHGS-mut in BCa cells. (g) Stable knockdown efficiencies of circHGS in T24 and UM-UC-3 cells. (h-i) the relative expression levels of 3 miRnas in stably low-expressing circHGS T24 and UM-UC-3 cells were measured by qRT – PCR. Data are shown as the means ± SD of three independent experiments, * P < 0.05, **P < 0.01.
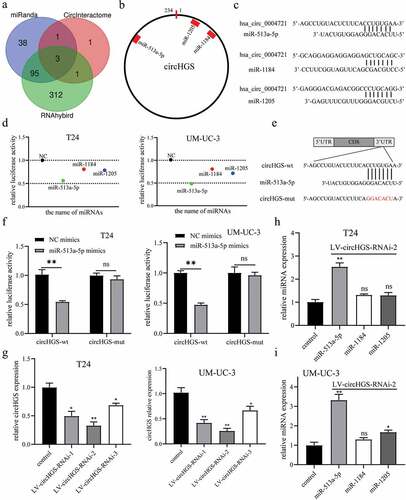
Figure 5. MiR-513a-5p suppressed BCa cell proliferation, migration and invasion. (a-b) the expression of miR-513a-5p was downregulated in BCa tissues and cells. (c) Correlation of circHGS and miR-513a-5p relative expression in 30 BCa tissues. (d-h) CCK8 assays and colony formation assays were performed to detect the proliferation abilities of T24 and UM-UC-3 cells treated with miR-513a-5p mimics. (i-j) Transwell assays were used to detect the effects of miR-513a-5p overexpression on the migration and invasion of BCa cells. (k-m) Wound-healing assays were applied to detect the migration abilities of BCa cells treated with miR-513a-5p mimics. Data are shown as the means ± SD of three independent experiments, * P < 0.05, **P < 0.01, ***P < 0.001.
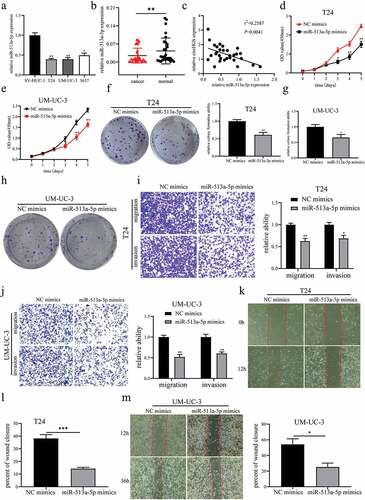
Figure 6. VEGFC was a target gene of miR-513a-5p. (a) Bioinformatics analysis was performed to predict potential target genes of miR-513a-5p. (b) the effects of miR-513a-5p on predicted target gene expression levels in BCa cells. (c) the effects of circHGS knockdown on predicted target gene expression levels. (d) Correlation of VEGFC and miR-513a-5p relative expression in 30 BCa tissues. (e) the binding sites of miR-513a-5p and VEGFC-wt. (f) Dual-luciferase reporter gene assays were performed to determine the interactions between miR-513a-5p and VEGFC-wt or VEGFC-mut in T24 and UM-UC-3 cells. Data are shown as the means ± SD of three independent experiments, * P < 0.05, **P < 0.01.
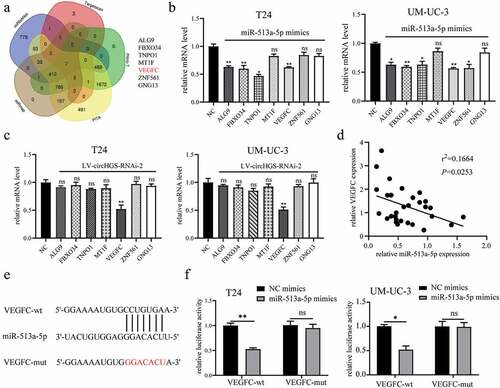
Figure 7. MiR-513a-5p reversed the oncogenic roles of circHGS in vitro. (a) a colony formation assay indicated that cell proliferation ability of T24 cells transfected with circHGS overexpression plasmid was abolished after cotransfection with miR-513a-5p mimics. (b) Transwell migration and Matrigel invasion assays showed that cell migration and invasion capabilities of T24 cells transfected with circHGS overexpression plasmid were abrogated after cotransfection with miR-513a-5p mimics. (c) Wound-healing assays demonstrated that cell migration ability of T24 cells transfected with circHGS overexpression plasmid was counteracted after cotransfection with miR-513a-5p mimics. Data are shown as the means ± SD of three independent experiments, * P < 0.05, **P < 0.01.
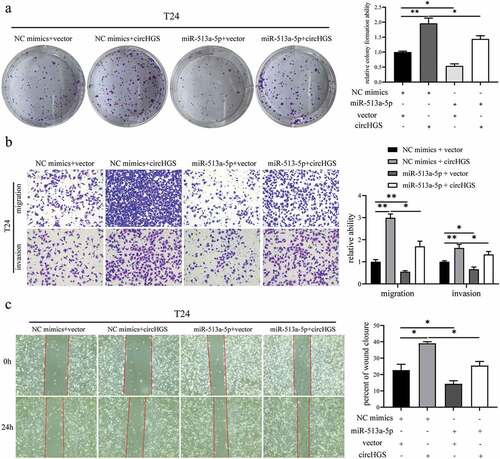
Figure 8. The effects of circHGS and miR-513a-5p on VEGFC and the AKT/mTOR signaling pathway. (a) the effects of silencing circHGS on VEGFC and the AKT/mTOR signaling pathway in T24 and UM-UC-3 cells. (b) the effects of miR-513a-5p overexpression on the target gene VEGFC and the AKT/mTOR signaling pathway in BCa cells. (c) the effects of circHGS overexpression on VEGFC and the AKT/mTOR signaling pathway in T24 and UM-UC-3 cells. Data are shown as the means ± SD of three independent experiments, * P < 0.05, **P < 0.01, ***P < 0.001.
Figure 9. CircHGS upregulated VEGFC expression and activated the AKT/mTOR signaling pathway by sponging miR-513a-5p. (a-d) CircHGS overexpression upregulated VEGFC expression and activated the AKT/mTOR signaling pathway, effects that were abolished by miR-513a-5p overexpression in T24 and UM-UC-3 cells. Data are shown as the means ± SD of three independent experiments, * P < 0.05, **P < 0.01.
Figure 10. Knockdown of circHGS inhibited tumor growth in vivo. (a) Subcutaneous tumors in BALB/c nude mice. (b) Tumor tissues were excised from BALB/c nude mice in the control and LV-circHGS-RNAi-2 groups. (c) Tumor volumes of xenograft tumors at different time points. (d) Compared with the control group, the tumor weight was significantly reduced in the LV-circHGS-RNAi-2 group. Data are shown as the means ± SD of three independent experiments, * P < 0.05.
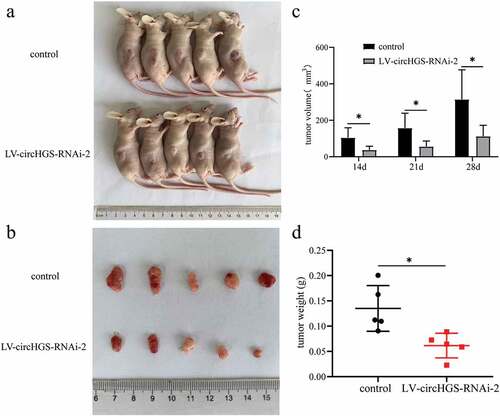
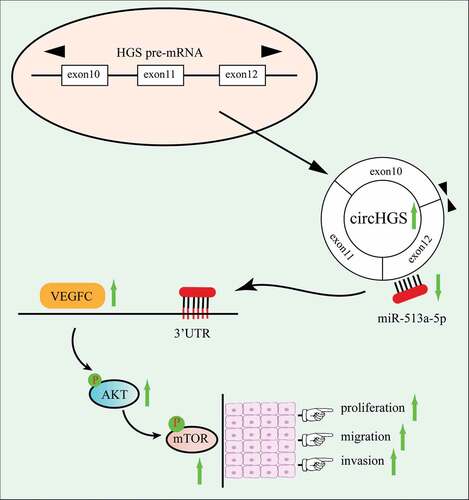
Figure 11. Mechanistic diagram of circHGS in BCa. circHGS promotes BCa proliferation, migration and invasion by regulating the miR-513a-5p/vegfc/akt/mtor axis.
Supplemental Material
Download Zip (12.4 KB)Data availability statement
The data analyzed in this study are available from the corresponding author on reasonable request.