Figures & data
Figure 1. Age structure of migrant stock of India in 2011 and China in 2010 and 2020.
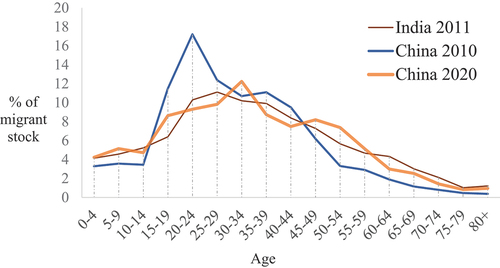
Figure 2. Age pyramid of the “floating population” in China, 2010 and 2020.
Sources: NBS (Citation2012, Citation2022).
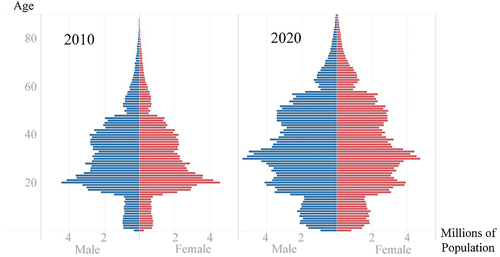
Table 1. Median age of the total population, “at-risk population”, and “floating population” in China.
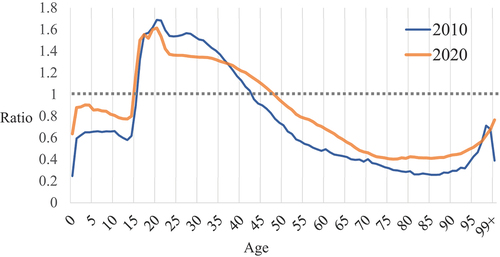
Figure 3. Ratio of the “floating population” to “at-risk population” in China by age, 2010 and 2020.
Sources: NBS (Citation2012, Citation2022).