
Figures & data
Figure 1. Schematic of oblique impact experimental setup.
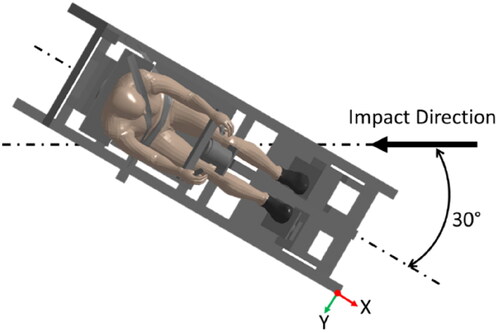
Figure 2. Setup for simulating field tests.
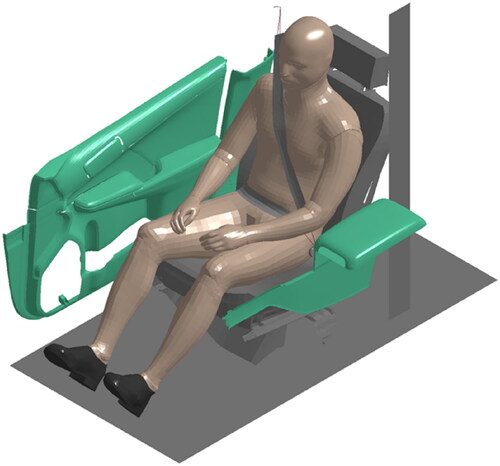
Table 1. Volunteer sled test simulation matrix.
Figure 3. Comparison of head CG peak forward excursion of both models in braking event (top view). The head outline was created using the midsize male model and the CG of the head was placed at the experimental mean.
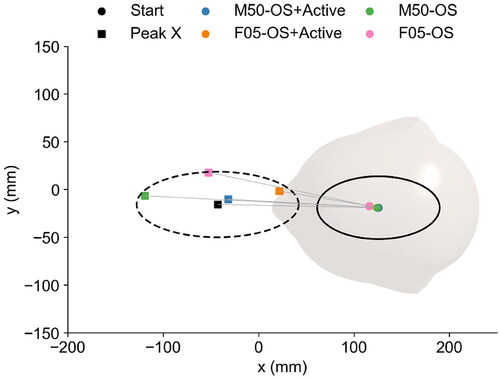
Figure 4. Comparison of head CG peak lateral excursion of both models in lane change event (top view). The head outline was created using the midsize male model and the CG of the head was placed at the experimental mean.
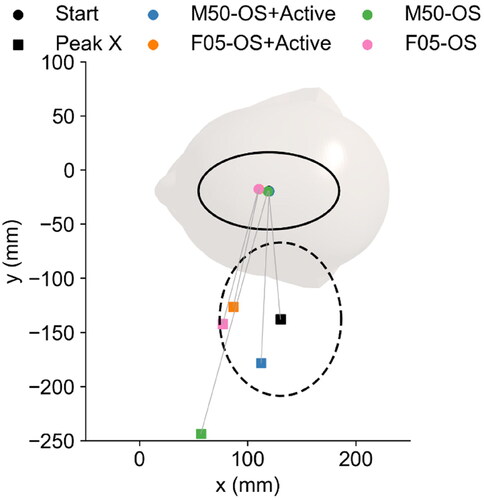
Table 2. Field tests simulation matrix.
Figure 5. Comparison of head CG peak lateral and forward excursion of both models in turn and brake event (top view). The head outline was created using the midsize male model and the CG of the head was placed at the experimental mean.
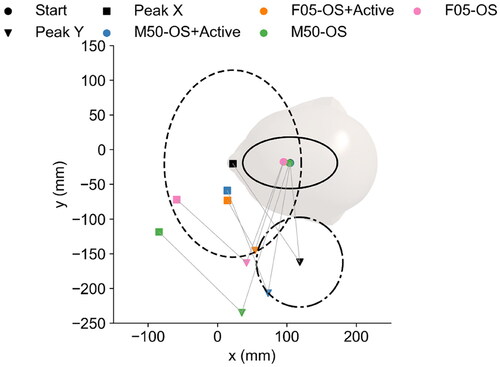
Table 3. Comparison of CORA scores for both models in relaxed and braced muscle conditions for volunteer sled tests and Wilcoxon signed-rank test p-value using peak forward and lateral excursion data.
Table 4. Average CORA scores of both models in field tests simulations.
Table 5. Overall CORA scores of both models.