Figures & data
Table 1. Smartphone functions used while driving by young adults in the past week.
Figure 1. Flowchart of stages of the study.
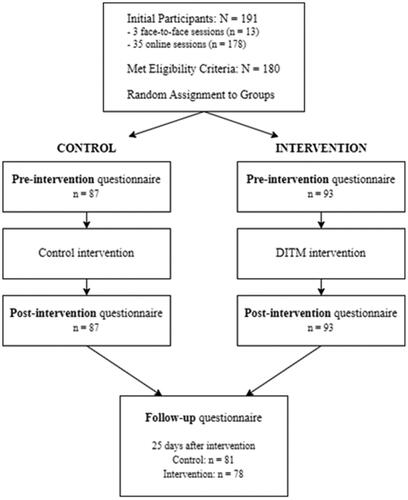
Figure 2. The effect of Time and Group on number of times participants used SWD in previous week. The only significant effect is the decrease in SWD in the intervention group. Estimated marginal means, with error bars denoting 95% confidence intervals.
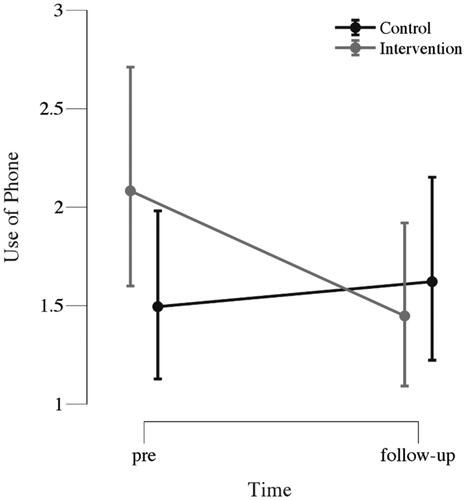
Figure 3. The effect of Time and Group on future intentions. There is a significant effect for Time and no other significant effects. Estimated marginal means, with error bars denoting 95% confidence intervals.
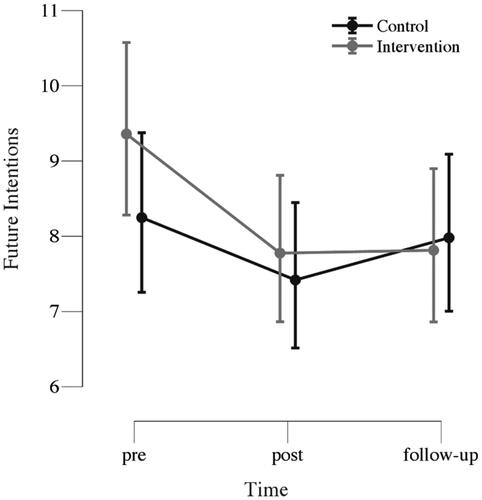
Figure 4. The effect of Time and Group on the perceived risk of having a crash. The intervention group showed a transient effect on the perceived risk of having a crash after the intervention. This effect did not persist at follow-up. Estimated marginal means, with error bars denoting 95% confidence intervals.
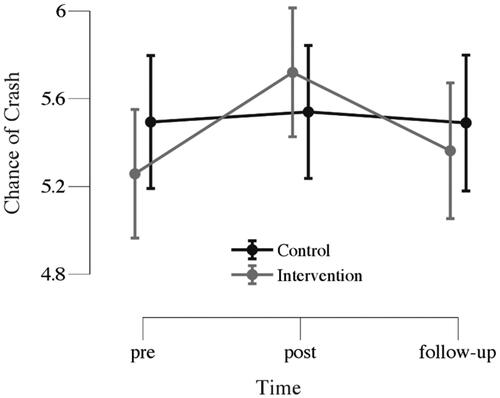
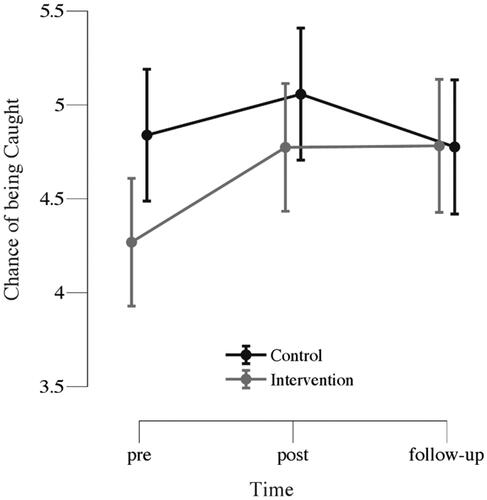
Figure 5. The effect of Time and Group on the perceived risk of being apprehended by police while using a SWD. There is a significant effect in the intervention group which was maintained at follow-up. Estimated marginal means, with error bars denoting 95% confidence intervals.