Figures & data
Table 1. Overview of participants by medication used. LT3− = medication use in-between 6 months and 3 years; LT3+ = medication use longer than 3 years.
Figure 1. The driving simulator.
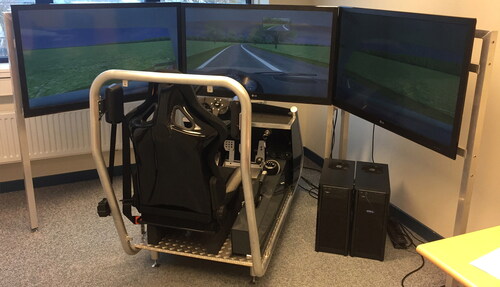
Table 2. Summary of results.
Figure 2. Non-inferiority analyses of swerving behavior (SDLP, cm), SD speed (km/h), time headway (THW, s), and reaction time (RTTL, s) of anxiolytics users. Bars show differences (medication user – matched control), with the 95% confidence interval. The dashed orange line represents the reference value that was found at 0.5‰ alcohol in a repeated measures study (Van Dijken et al. Citation2020).
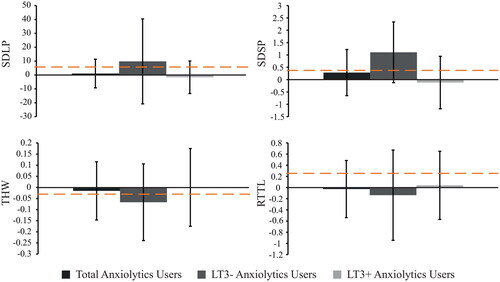
Figure 3. Non-inferiority analyses of antidepressants users. Bars show differences (medication user – matched control), with the 95% confidence interval. The dashed orange line represents the reference value that was found at 0.5‰ alcohol in a repeated measures study (Van Dijken et al. Citation2020).
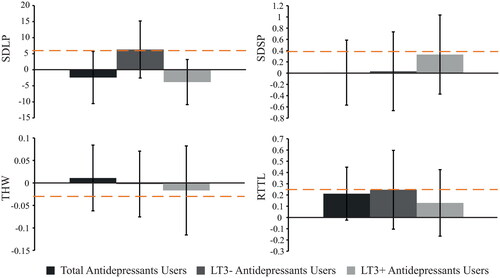
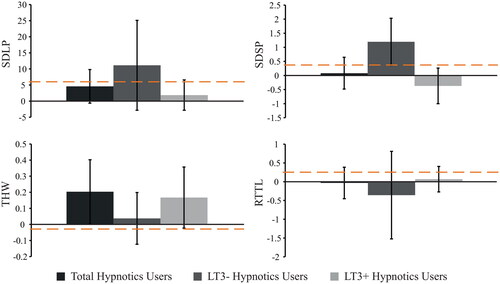
Figure 4. Non-inferiority analyses of hypnotics users. Bars show differences (medication user – matched control), with the 95% confidence interval. The dashed orange line represents the reference value that was found at 0.5‰ alcohol in a repeated measures study (Van Dijken et al. Citation2020).