Figures & data
Figure 1. Effect of quercetin and cigarette smoke extract on J774A.1 cell viability within 24 h. (A) Analysis of quercetin administration (0.8, 1.6, 3.12, 6.25, 12.5, 25, 50 and 100 μM) on cell viability of J774. (B) Analysis of cigarette smoke extract administration (0.15, 0.3, 0.6, 1.25, 2.5, 5, 10 and 20%) on cell viability of J774. Data were expressed in median, minimum and maximum value and were analyzed by Kruskal-Wallis followed by Dunn’s post-test (p < 0.05). The letter (a) represents a significant difference when compared to control. This test was performed in sextuplicate from two independent experiments.
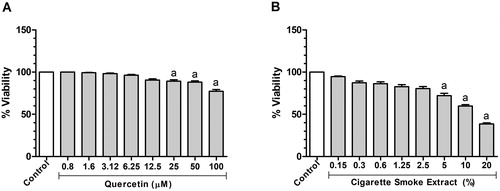
Figure 2. Effect of cigarette smoke extract and quercetin on ROS and NO production in J774A.1 cell. (A) Quantitative analysis of ROS production in J774 cells administered with Quercetin (10, 25 and 50 μM) and/or CSE (0.5%). (B) NO production measured as nitrite content J774 cells administered with Quercetin (10, 25 and 50 μM) and/or CSE (0.5%). Data are expressed as mean ± standard error of the mean and were analyzed by one-way ANOVA followed by Tukey’s post-test (n = 5-8, p < 0.05). The letter (a) represents a significant difference when compared to control. The letter (b) represents a significant difference when compared to Q10. The letter (c) represents a significant difference when compared to Q25. The letter (d) represents a significant difference when compared to Q50. The letter (e) represents a significant difference when compared to CSE.
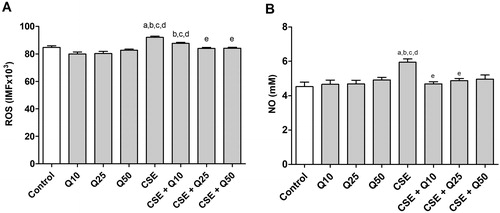
Table 1. Assessment of lung function in mice.
Table 2. Hematological parameters of experimental groups.
Figure 3. Total and differential count of bronchoalveolar lavage fluid. CG: control group; VG: vehicle group; QG: quercetin group; CSG: cigarette smoke group; QCSG: quercetin and cigarette smoke group. The letter (a) represents a significant difference between groups when compared to CG. The letter (b) represents a significant difference between groups when compared to VG. The letter (c) represents a significant difference between groups when compared to QG. The letter (d) represents a significant difference between groups when compared to CSG. Data are expressed as mean ± standard error of the mean and were analyzed by one-way ANOVA followed by Tukey’s post-test, n = 5 animals per group, p < 0.05.
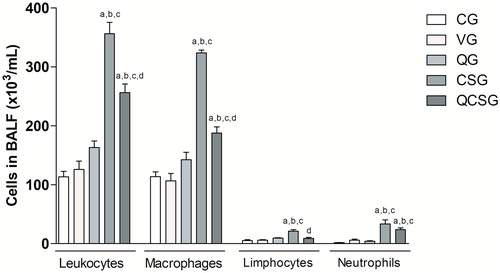
Table 3. Antioxidant defense and oxidative stress biomarkers in lung homogenates.
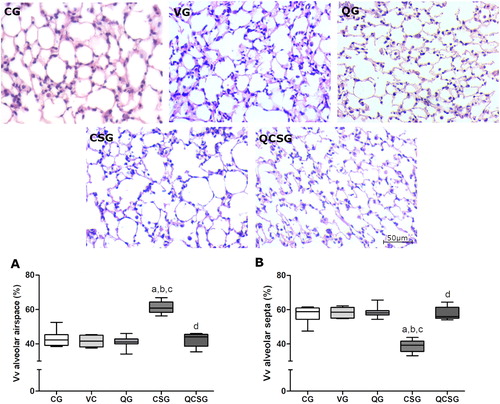
Figure 4. Morphometric evaluations of the lung parenchyma. Photomicrographs of lung sections stained with hematoxylin and eosin. Bar = 50 µm, 400x magnification. CG: control group; VG: vehicle group; QG: quercetin group; CSG: cigarette smoke group; QCSG: quercetin and cigarette smoke group. (A) Volume density of alveolar septa. (B) Volume density of alveolar airspace. The letter (a) represents a significant difference between CSG when compared to CG. The letter (b) represents a significant difference between CSG when compared to VG. The letter (c) represents a significant difference between CSG when compared to QG. The letter (d) represents a significant difference between QCSG when compared to CSG. For A and B, data were expressed in median, minimum and maximum value and were analyzed by Kruskal-Wallis followed by Dunn’s post-test, n = 5 animals per group, p < 0.05.