
Figures & data
Table 1. Patient characteristics.
Figure 1. Legend: Bronchial ciliary function in COPD and controls. (A) CBF: ciliary beat frequency, (B) dyskinesia index, (C) immotility index. ***p < 0.001.
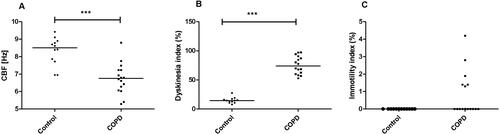
Table 2. Ciliary function in COPD and controls.
Figure 2. Legend: transmission electron microscopy (TEM) images of ciliated respiratory epithelium from a healthy ex-smoking control subject (A) showing normal mitochondria (arrow), and a patient with COPD (B–F) showing significant loss of cilia (B), abnormal mitochondria (C), projecting cell (D), cytoplasmic bleb (E) and dead cell (F). Internal scale bar = 2 µm.
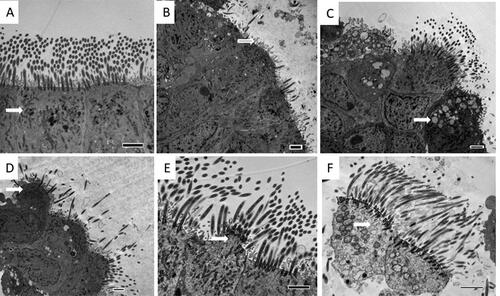
Table 3. Ultrastructure of bronchial epithelium in COPD and controls.