2,246
Views
4
CrossRef citations to date
0
Altmetric
Original

Functional Characterization of Integrin α6β4 Adhesion Interactions Using Soluble Integrin Constructs Reveals the Involvement of Different Functional Domains in the β4 Subunit

, , , , , , , , , , & show all
Pages 317-331 | Received 26 Jun 2008, Published online: 11 Jul 2009

Figures & data

Figure 1.  Purification of soluble α6β4 proteins. (A) α6-Fcβ4 (top panel) and α6β4-Fc (bottom panel) proteins were purified from α6-Fcβ4– or α6β4-Fc–transfected CHO cell supernatants respectively by protein A chromatography. Protein purity in column fractions in the load (L), flow through (FT), wash (W), and elution fractions (1, 2, 3) was assessed by SDS-PAGE under nonreducing conditions. α6-Fc, β4, β4-Fc, and α6 bands at predicted sizes of 272, 77, 204, 110 kDa, respectively, are indicated. (B) The identity of the purified α6-Fcβ4 (top panel) or α6β4-Fc (bottom panel) material was confirmed by Western blotting under nonreducing conditions with antibodies to α6 and β4. (C) SEC and light scattering (top right inset; RI = refractive index, MW = molecular weight) analysis shows soluble α6-Fcβ4 migrating at the approximate size of a tetramer (449.4 kDa). Predicted size of two α6-Fc subunits plus two β4 subunits is 426 kDa. Inset (top left) is a cartoon of the α6-Fcβ4 tetramer.
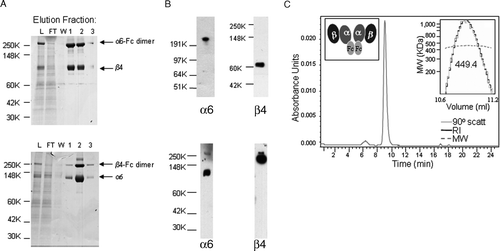
Figure 1.  Purification of soluble α6β4 proteins. (A) α6-Fcβ4 (top panel) and α6β4-Fc (bottom panel) proteins were purified from α6-Fcβ4– or α6β4-Fc–transfected CHO cell supernatants respectively by protein A chromatography. Protein purity in column fractions in the load (L), flow through (FT), wash (W), and elution fractions (1, 2, 3) was assessed by SDS-PAGE under nonreducing conditions. α6-Fc, β4, β4-Fc, and α6 bands at predicted sizes of 272, 77, 204, 110 kDa, respectively, are indicated. (B) The identity of the purified α6-Fcβ4 (top panel) or α6β4-Fc (bottom panel) material was confirmed by Western blotting under nonreducing conditions with antibodies to α6 and β4. (C) SEC and light scattering (top right inset; RI = refractive index, MW = molecular weight) analysis shows soluble α6-Fcβ4 migrating at the approximate size of a tetramer (449.4 kDa). Predicted size of two α6-Fc subunits plus two β4 subunits is 426 kDa. Inset (top left) is a cartoon of the α6-Fcβ4 tetramer.

Figure 2.  α6β4 antibodies recognize both soluble and endogenous proteins. (A) Plates were coated with the indicated proteins then incubated with α6- (4F10) or β4- (ASC-3 and ASC-8) specific antibodies. Antibody binding was detected using an HRP-conjugated anti-mouse antibody as described. (B–D) Binding characteristics of β4- or α6-specific antibodies were determined by flow cytometry on colorectal tumor cell lines SW620 (B) and SW480 (C), and breast tumor cell line MDA-MB-231 (D).
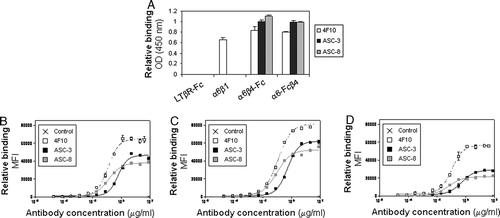
Figure 2.  α6β4 antibodies recognize both soluble and endogenous proteins. (A) Plates were coated with the indicated proteins then incubated with α6- (4F10) or β4- (ASC-3 and ASC-8) specific antibodies. Antibody binding was detected using an HRP-conjugated anti-mouse antibody as described. (B–D) Binding characteristics of β4- or α6-specific antibodies were determined by flow cytometry on colorectal tumor cell lines SW620 (B) and SW480 (C), and breast tumor cell line MDA-MB-231 (D).

Figure 3.  Ligand binding specificity of soluble α6β4 proteins is comparable to that of endogeous α6β4. (A, B) Purified α6-Fcβ4 (A) or α6β4-Fc (B) were incubated on plates coated with the indicated extracellular matrix proteins in the presence of 10 mM MgCl2 (grey and black bars), 1 mM MnCl2 (dashed lines), or 10 mM EDTA (white bars). After washing, bound α6-Fcβ4 or α6β4-Fc was detected using an HRP-conjugated anti-human antibody. (C) Colorectal tumor cells (SW480) were starved for 24 h in serum-free medium. Cells were held in suspension for 1 h on ice prior to plating on 96-well plates coated with the indicated matrices for 1 h at 4°C. Relative adhesion was measured using a luciferase-based luminescent viability assay.
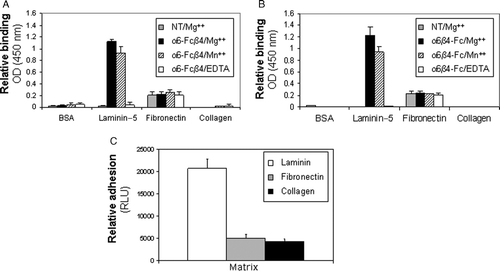
Figure 3.  Ligand binding specificity of soluble α6β4 proteins is comparable to that of endogeous α6β4. (A, B) Purified α6-Fcβ4 (A) or α6β4-Fc (B) were incubated on plates coated with the indicated extracellular matrix proteins in the presence of 10 mM MgCl2 (grey and black bars), 1 mM MnCl2 (dashed lines), or 10 mM EDTA (white bars). After washing, bound α6-Fcβ4 or α6β4-Fc was detected using an HRP-conjugated anti-human antibody. (C) Colorectal tumor cells (SW480) were starved for 24 h in serum-free medium. Cells were held in suspension for 1 h on ice prior to plating on 96-well plates coated with the indicated matrices for 1 h at 4°C. Relative adhesion was measured using a luciferase-based luminescent viability assay.

Figure 4.  Effect of β4-specific antibodies on α6β4-laminin adhesion. (A) Purified α6-Fcβ4 or α6β4-Fc proteins were left untreated (NT; white bars), preincubated with a β3-specific control antibody (Anti-β3; dashed bars) or β4-specific antibodies (ASC-3; black bars, ASC-8; grey bars) prior to plating on laminin-5–coated ELISA plates. Bound α6β4 proteins were detected using an HRP-conjugated anti-human antibody. (B) Colorectal tumor cells (SW480) were starved for 24 h in serum-free medium. Cells were left untreated (NT; white bars), treated with a β3-specific control antibody (Anti-β3; dashed bars) or with β4-specific antibodies (ASC-3; black bars, ASC-8; grey bars) and held in suspension for 1 h on ice prior to plating on laminin-5–coated plates for 1 h at 4°C. Relative adhesion was measured using a luciferase-based luminescent viability assay.

Figure 4.  Effect of β4-specific antibodies on α6β4-laminin adhesion. (A) Purified α6-Fcβ4 or α6β4-Fc proteins were left untreated (NT; white bars), preincubated with a β3-specific control antibody (Anti-β3; dashed bars) or β4-specific antibodies (ASC-3; black bars, ASC-8; grey bars) prior to plating on laminin-5–coated ELISA plates. Bound α6β4 proteins were detected using an HRP-conjugated anti-human antibody. (B) Colorectal tumor cells (SW480) were starved for 24 h in serum-free medium. Cells were left untreated (NT; white bars), treated with a β3-specific control antibody (Anti-β3; dashed bars) or with β4-specific antibodies (ASC-3; black bars, ASC-8; grey bars) and held in suspension for 1 h on ice prior to plating on laminin-5–coated plates for 1 h at 4°C. Relative adhesion was measured using a luciferase-based luminescent viability assay.

Figure 5.  β4 antibodies recognize different epitopes on α6β4. (A) Biotinylated ASC-3 or ASC-8 were allowed to bind to α6-Fcβ4–coated plates preincubated with saturating concentrations of unlabeled antibodies for 1 h, then detected using avidin-HRP. (B) Purified β4 was obtained from α6-Fcβ4 as described and analyzed by SDS-PAGE under nonreducing conditions (lane 1: α6Fc-β4; lane 2: purified β4 protein). α6-Fc and β4 bands at predicted sizes of 272 and 77 kDa, respectively are indicated. (C) ASC-3 or ASC-8 (0.1 µg/ml) were incubated on α6-Fcβ4 (0.1 µg/ml)–coated plates in the presence of increasing amounts of β4 protein. Bound antibodies were detected using an HRP-conjugated anti-mouse antibody as described.
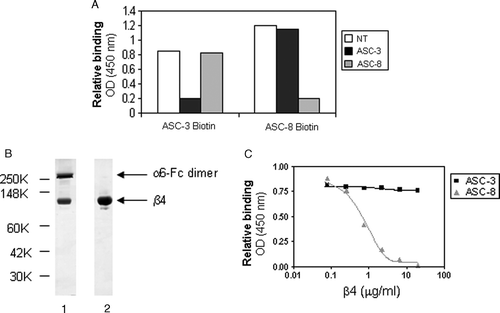
Figure 5.  β4 antibodies recognize different epitopes on α6β4. (A) Biotinylated ASC-3 or ASC-8 were allowed to bind to α6-Fcβ4–coated plates preincubated with saturating concentrations of unlabeled antibodies for 1 h, then detected using avidin-HRP. (B) Purified β4 was obtained from α6-Fcβ4 as described and analyzed by SDS-PAGE under nonreducing conditions (lane 1: α6Fc-β4; lane 2: purified β4 protein). α6-Fc and β4 bands at predicted sizes of 272 and 77 kDa, respectively are indicated. (C) ASC-3 or ASC-8 (0.1 µg/ml) were incubated on α6-Fcβ4 (0.1 µg/ml)–coated plates in the presence of increasing amounts of β4 protein. Bound antibodies were detected using an HRP-conjugated anti-mouse antibody as described.

Figure 6.  β4-specific antibodies exhibited different kinetic parameters by surface plasmon resonance. Concentrations of ASC-3 (A) or ASC-8 (B) ranging from 500 or 30 nM to 2 or 1.2 nM, respectively, were allowed to flow over an anti-human IgG1 coupled CM-5 chip saturated with α6-Fcβ4.
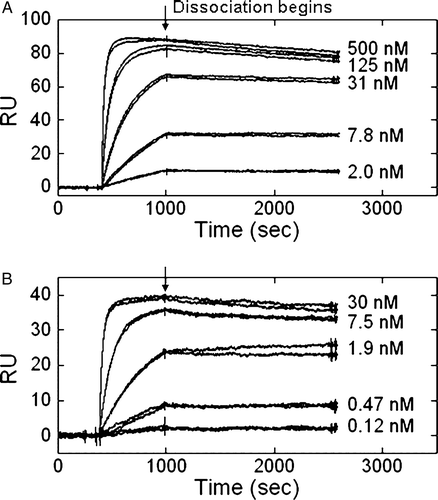
Figure 6.  β4-specific antibodies exhibited different kinetic parameters by surface plasmon resonance. Concentrations of ASC-3 (A) or ASC-8 (B) ranging from 500 or 30 nM to 2 or 1.2 nM, respectively, were allowed to flow over an anti-human IgG1 coupled CM-5 chip saturated with α6-Fcβ4.

Figure 7.  Effects of β4-specific antibodies on anchorage-independent growth. (A) Colon (SW620) or (B) breast (MDA-MB-231) cancer cells were grown in 0.3% soft agar containing ASC-3 or ASC-8 (10 µg/ml). Plates were supplemented twice weekly with antibody-containing medium. Anchorage-independent growth was scored by manual counting of colonies >150 µm 21 to 27 days after plating. Error bars represent variation between duplicates. Pictures of colonies are representative examples. Size bar represents 199 µm.
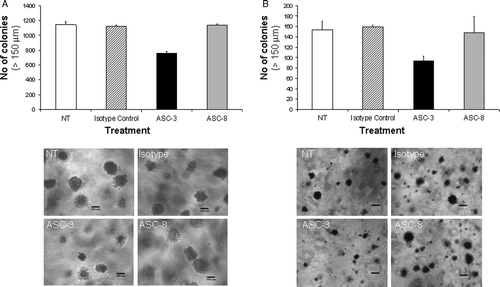
Figure 7.  Effects of β4-specific antibodies on anchorage-independent growth. (A) Colon (SW620) or (B) breast (MDA-MB-231) cancer cells were grown in 0.3% soft agar containing ASC-3 or ASC-8 (10 µg/ml). Plates were supplemented twice weekly with antibody-containing medium. Anchorage-independent growth was scored by manual counting of colonies >150 µm 21 to 27 days after plating. Error bars represent variation between duplicates. Pictures of colonies are representative examples. Size bar represents 199 µm.

Reprints and Corporate Permissions

Please note: Selecting permissions does not provide access to the full text of the article, please see our help page How do I view content?

To request a reprint or corporate permissions for this article, please click on the relevant link below:

Academic Permissions

Please note: Selecting permissions does not provide access to the full text of the article, please see our help page How do I view content?

Obtain permissions instantly via Rightslink by clicking on the button below:

If you are unable to obtain permissions via Rightslink, please complete and submit this Permissions form. For more information, please visit our Permissions help page.