Figures & data
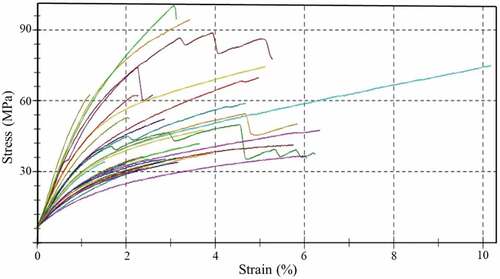
Figure 1. Extraction process. Image of (a) Pinus Roxburghii tree (b) needle with stem (c) before fiber extraction (d) after trimming the top and the bottom portion, (e) soaked in water, (f) extracted fiber (wet stage) and (g) extracted Pinus Roxburghii fiber (dry stage).
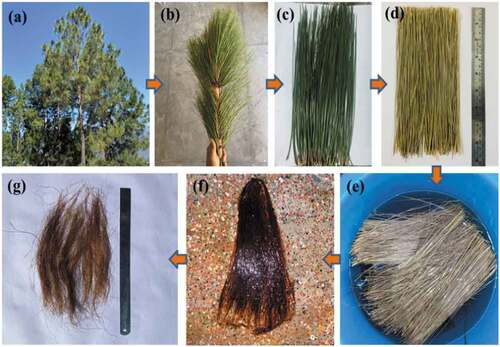
Figure 2. Optical microscopic image of a single extracted PRF showing diameter measurement.
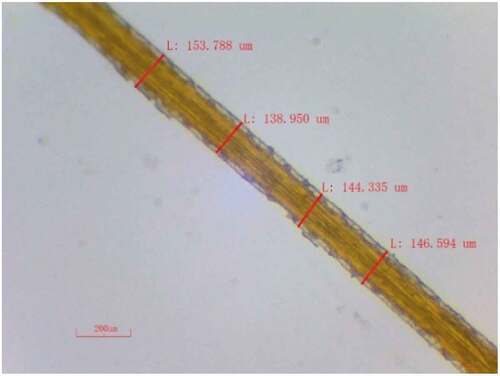
Table 1. Comparison of various properties of PRFs with other natural fibers.
Table 2. Percentage of chemical constituents present in PRFs and other natural fibers.
Figure 3. (a) FTIR spectra of PRFs (b) XRD diffractograms of PRFs.
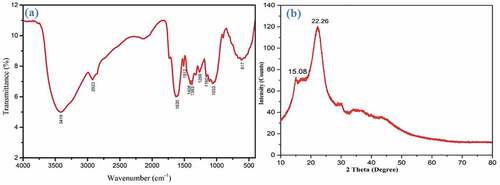
Figure 4. TG and DTG analysis curve for PRFs.
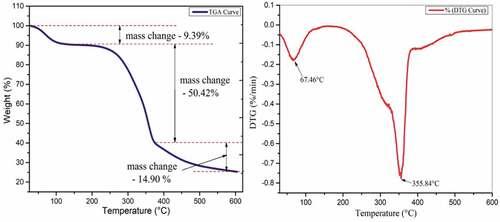
Figure 5. FESEM images of the PRFs (a) Showing void space (b) Showing wax content (c) Circular cross-section.
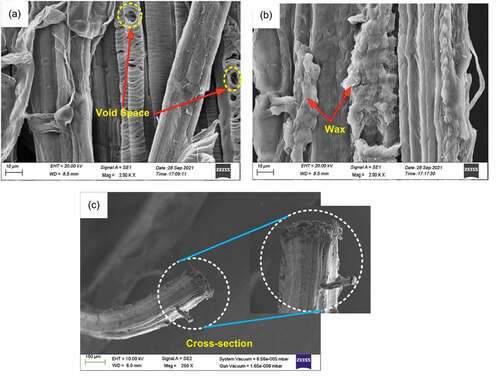
Figure 6. AFM analysis of PRFs: (a) 2D image and (b) 3D image.
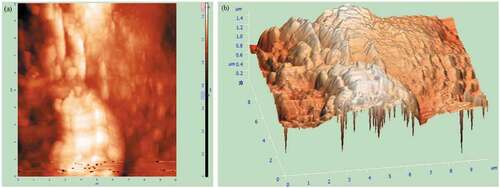
Figure 7. EDX analysis of PRFs.
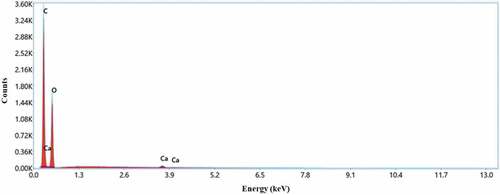
Figure 8. Stress-strain diagram of PRFs.