Figures & data
Figure 1. The protein expression levels of RPS6, akt, p-akt, and mTOR were examined by Western blot analysis. The protein expression levels are displayed as the mean ± SEM (n = 3). The data were only tested by the t-test for dependent samples (p-value <.05 was considered significant, mean ± SEM).
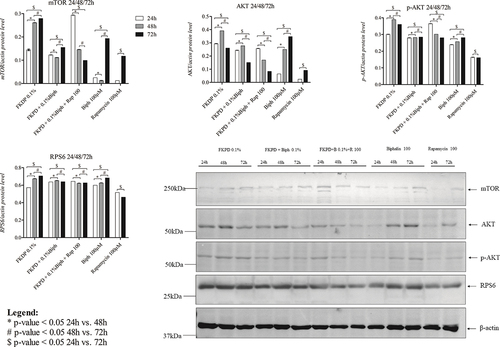
Figure 2. The effect of fur keratin-derived powder containing biphalin on skin wound healing. Because of the decreasing number of surviving mice, the data (mean ± SEM) were only tested by the t-test for dependent samples (for each post-wounding day separately), with no prior two-way analysis of variance. * - p < .05, ** p < .01.
Figure 3. a) microscopic view of control and fur keratin-derived powder containing biphalin (FKDP +0.1%Biph)-treated wounds during the course of healing; hematoxylin-eosin. Original magnification: 100 × .Legend: - epidermis; - hair follicle; - empty zones; - blood extravasation, (color online, black and white in print). b) microscopic view of the control and FKDP + 0.1%Biph-treated wounds during the healing process. H&E. white arrow – neutrophils, black arrow – macrophages, green arrow – multinucleated giant cells, black & white arrow – lymphocytes; magnification 100× (color online, black & white in print). c) type of cells infiltrating FKDP + 0.1%Biph and control wound during tissue recovery visible under the light microscopy (the data were only tested by the t-test for dependent samples, p-value <.05 was considered significant) (color online, black and white in print).
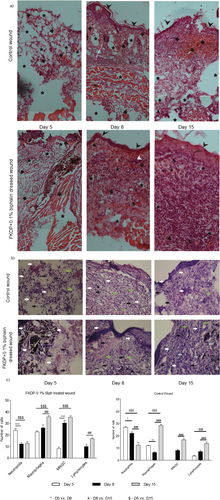
Figure 4. a) tissue biopsy taken from FKDP + 0.1%Biph (3 upper panels) treated and control wounds (lower panel) immunolabeled for neutrophils (green), nucleus (blue). b) tissue biopsy taken from FKDP + 0.1%Biph (3 upper panels) treated and control wounds (lower panel) immunolabeled for lymphocytes (green), nucleus (blue). Note the changes in immunoreactive cell numbers during the healing course (color online, black & white in print) (color online, black and white in print).
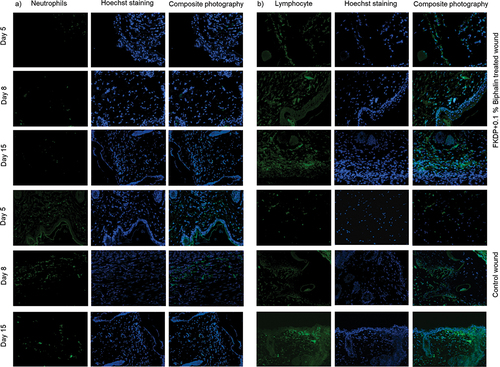
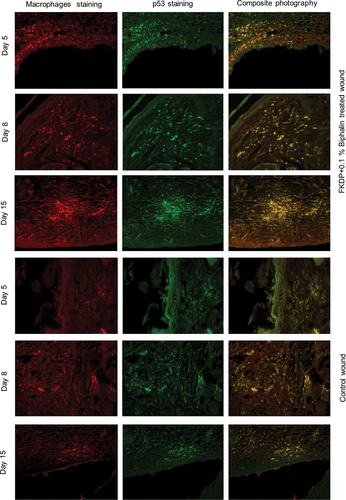
Figure 5. Tissue biopsy taken from FKDP + 0.1%Biph (3 upper panels) treated and control wounds (lower panel) immunolabeled for macrophages (red), p53 (green). Note the changes in immunoreactive cell numbers during the healing course (color online, black & white in print).