5,135
Views
66
CrossRef citations to date
0
Altmetric
Original Articles

Advances in Inhalation Dosimetry Models and Methods for Occupational Risk Assessment and Exposure Limit Derivation

, , &

Figures & data

Table 1 Uses of Dosimetry Models and Methods in Quantitative Risk Assessment

Table 2 Hierarchy of Dosimetry Models and Methods. Ordered from Simpler, Less Specific Approaches to More Complex, Chemical-Specific Approaches.
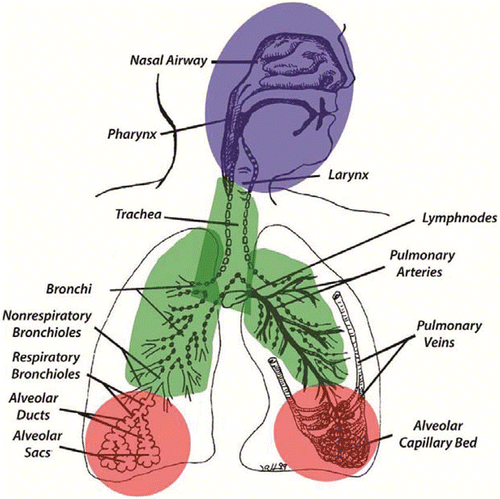
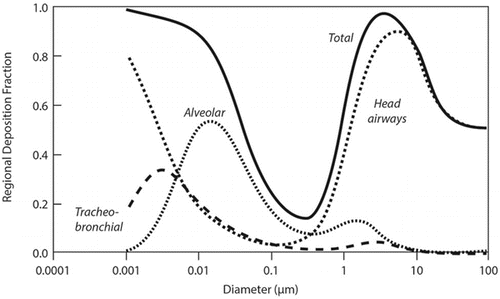
Figure 1 Human respiratory tract regions – associated with differences in particle-size specific deposition and clearance, and with differences in target tissue responses.(Citation89) (Drawing from Dr. Jack Harkema. Reproduced with permission from Environmental Health Perspectives.(Citation89)).
Figure 2 Particle aerodynamic diameter and deposition efficiency in human respiratory tract regions. ICRP model:(Citation7) light exercise, nose breathing. Regional deposition fraction depends on aerodynamic diameter (particles >300-500 nm) or on diffusion diameter (particles <300–500 nm).
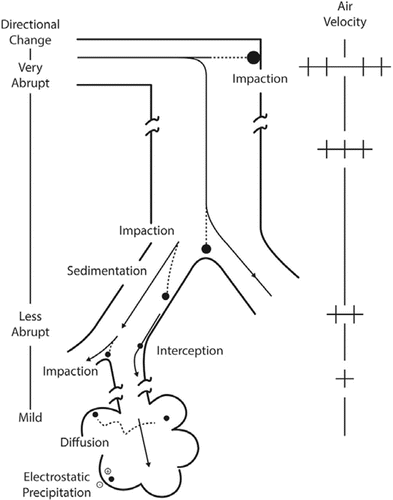
Figure 3 Factors influencing the deposition of inhaled particles in the respiratory tract.(Citation4) The mechanisms of particle deposition include: sedimentation from the gravitational settling of particles on the airway surfaces; impaction at airway bifurcations from the collision of particles in the airstream; and diffusion from brownian motion (random displacement of particles due to bombardment by air molecules causing small particles to come into contact with the airway walls).
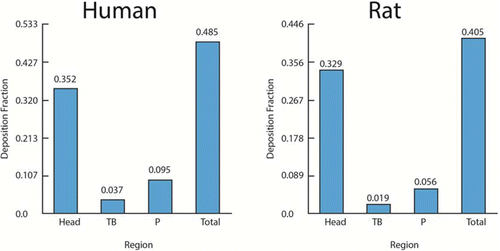
Figure 4 Respiratory tract deposition fractions in humans and rats from the Multipath Particle Deposition (MPPD) model, version 2.11.(Citation34) Example is for particles with mass median aerodynamic diameter of 1 μm and geometric standard deviation of 2. Additional input parameters selected include: Human model (Yeh-Shum); human reference worker breathing rate and pattern (i.e., 20 L/min, as tidal volume 1143 ml and breathing frequency 17.5/min; oronasal normal augmenter). Inhalability adjustment was selected in both human and rat models; other parameters were the default values in each model.

Table 3 Gas Categories and Characteristics(Citation4,Citation11)
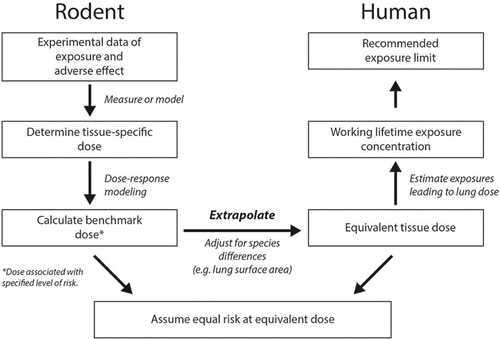
Figure 5 Dosimetry steps in quantitative risk assessment (QRA) to develop recommended exposure limits for inhaled particles (based on Oberdörster;(Citation167) Kuempel et al.;(Citation168) NIOSH(Citation72)).
Figure 6 Process for OSHA methylene chloride PEL development and risk estimate.(Citation112) In developing their final rule, OSHA used Bayesian analysis to fit their model to multiple pharmacokinetic data sets for mice and humans to arrive at estimates for posterior distributions of PBPK model parameter values. Using these posterior parameter distributions, estimates of the dose surrogates (production of metabolites via the glutathione-S-transferase [GST] pathway in the lung) produced in the key mouse bioassay were computed. OSHA conducted analyses using the human PBPK model with a baseline set of parameters for the GST pathway derived from the mouse values via allometric scaling and an alternative human GST pathway parameter set derived by incorporating human in vitro metabolism data using the parallelogram approach (as described in Reitz et al.(Citation169)). The mouse lung dose surrogates were used as inputs to derive the parameters for the linearized multistage cancer dose-response relationship. The human lung dose surrogates for the new PEL were then computed using the human PBPK model, and working lifetime cancer estimates derived from the 95th percent upper confidence limit of the baseline and alternative dose surrogates.
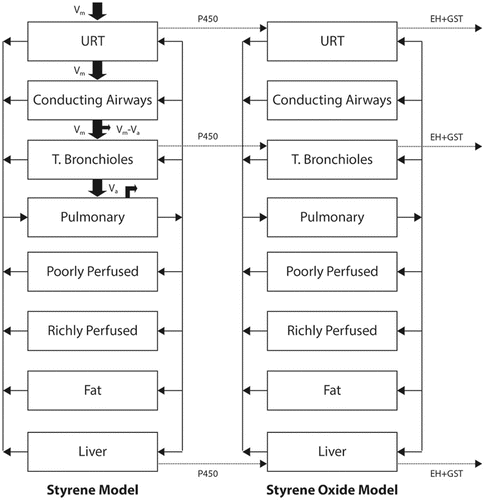
Figure 7 Schematic diagram of PBPK model for styrene dosimetry.(Citation123) Inhaled styrene passes through the upper respiratory tract, conducting airways, terminal bronchioles and alveolar (pulmonary) regions of the lung. Vapor can be absorbed into the blood in each of these regions (see ). Absorbed vapor is distributed throughout the body, which is models as compartments for poorly perfused tissues, richly perfused tissues, fat and liver as is done in classical PBPK models. A sub-model is used to describe styrene oxide disposition throughout the body. Styrene oxide is a cytochrome P450 monooxygenase metabolite that can be generated in the tissues labeled P450. (Sarangapani, R., J.G. Teeguarden, G. Cruzan, H.J. Clewell, and M.E. Andersen, Inhalation Toxicology, 2002; 14(8):789–834, copyright © 2002, Informa Healthacare. Reproduced with permission of Informa Healthcare.)
Figure 7 Schematic diagram of PBPK model for styrene dosimetry.(Citation123) Inhaled styrene passes through the upper respiratory tract, conducting airways, terminal bronchioles and alveolar (pulmonary) regions of the lung. Vapor can be absorbed into the blood in each of these regions (see Figure 8). Absorbed vapor is distributed throughout the body, which is models as compartments for poorly perfused tissues, richly perfused tissues, fat and liver as is done in classical PBPK models. A sub-model is used to describe styrene oxide disposition throughout the body. Styrene oxide is a cytochrome P450 monooxygenase metabolite that can be generated in the tissues labeled P450. (Sarangapani, R., J.G. Teeguarden, G. Cruzan, H.J. Clewell, and M.E. Andersen, Inhalation Toxicology, 2002; 14(8):789–834, copyright © 2002, Informa Healthacare. Reproduced with permission of Informa Healthcare.)
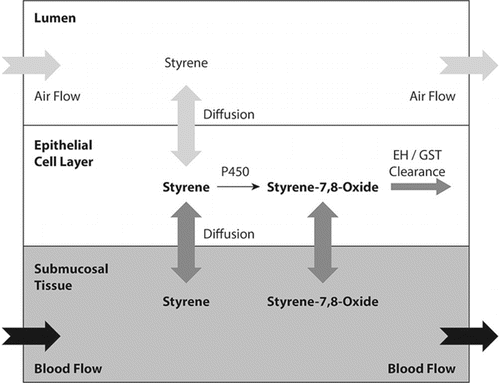
Figure 8 Airway compartment model.(Citation123) Compartments include the airway lumen, superficial airway epithelial compartment and deep airway submucosal tissue compartment. Blood is assumed to perfuse only the submucosal compartment. Styrene transfer between the air and superficial compartment is modeled according to mass transfer approaches. Transfer of styrene between tissue compartment occurs by molecular diffusion. Styrene metabolism via cytochrome P450 monooxygenases occurs in the epithelial layer. (Sarangapani, R., J.G. Teeguarden, G. Cruzan, H.J. Clewell, and M.E. Andersen, Inhalation Toxicology, 2002; 14(8):789–834, copyright © 2002, Informa Healthacare. Reproduced with permission of Informa Healthcare.)
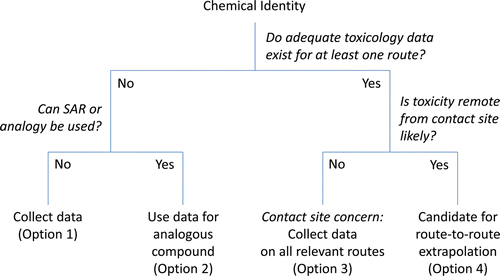
Figure 9 Flow-chart for consideration of route-to-route extrapolation.(Citation4,Citation170) Abbreviation: Structure-activity relationshiop (SAR).

Table 4 Examples of Available Tools and Resources for Dosimetry Modeling

Supplemental material

JOEH-14-0248-OnLineSupplemental-CLEAN_FINAL.docx

Download MS Word (23.8 KB)